Sample data: TPC-H
As described in the TPC Benchmark™ H (TPC-H) specification:
“TPC-H is a decision support benchmark. It consists of a suite of business-oriented ad hoc queries and concurrent data modifications. The queries and the data populating the database have been chosen to have broad industry-wide relevance. This benchmark illustrates decision support systems that examine large volumes of data, execute queries with a high degree of complexity, and give answers to critical business questions.”
Database and schemas
TPC-H comes with various data set sizes to test different scaling factors. For demonstration purposes, we’ve shared four versions of the TPC-H data. The data is provided in the following schemas in the SNOWFLAKE_SAMPLE_DATA shared database:
- TPCH_SF1: Consists of the base row size (several million elements).
- TPCH_SF10: Consists of the base row size x 10.
- TPCH_SF100: Consists of the base row size x 100 (several hundred million elements).
- TPCH_SF1000: Consists of the base row size x 1000 (several billion elements).
To access the full list of TPC-H queries, download this script.
Database entities, relationships, and characteristics
The components of TPC-H consist of eight separate and individual tables (the Base Tables). The relationships between columns in these tables are illustrated in the following ER diagram:
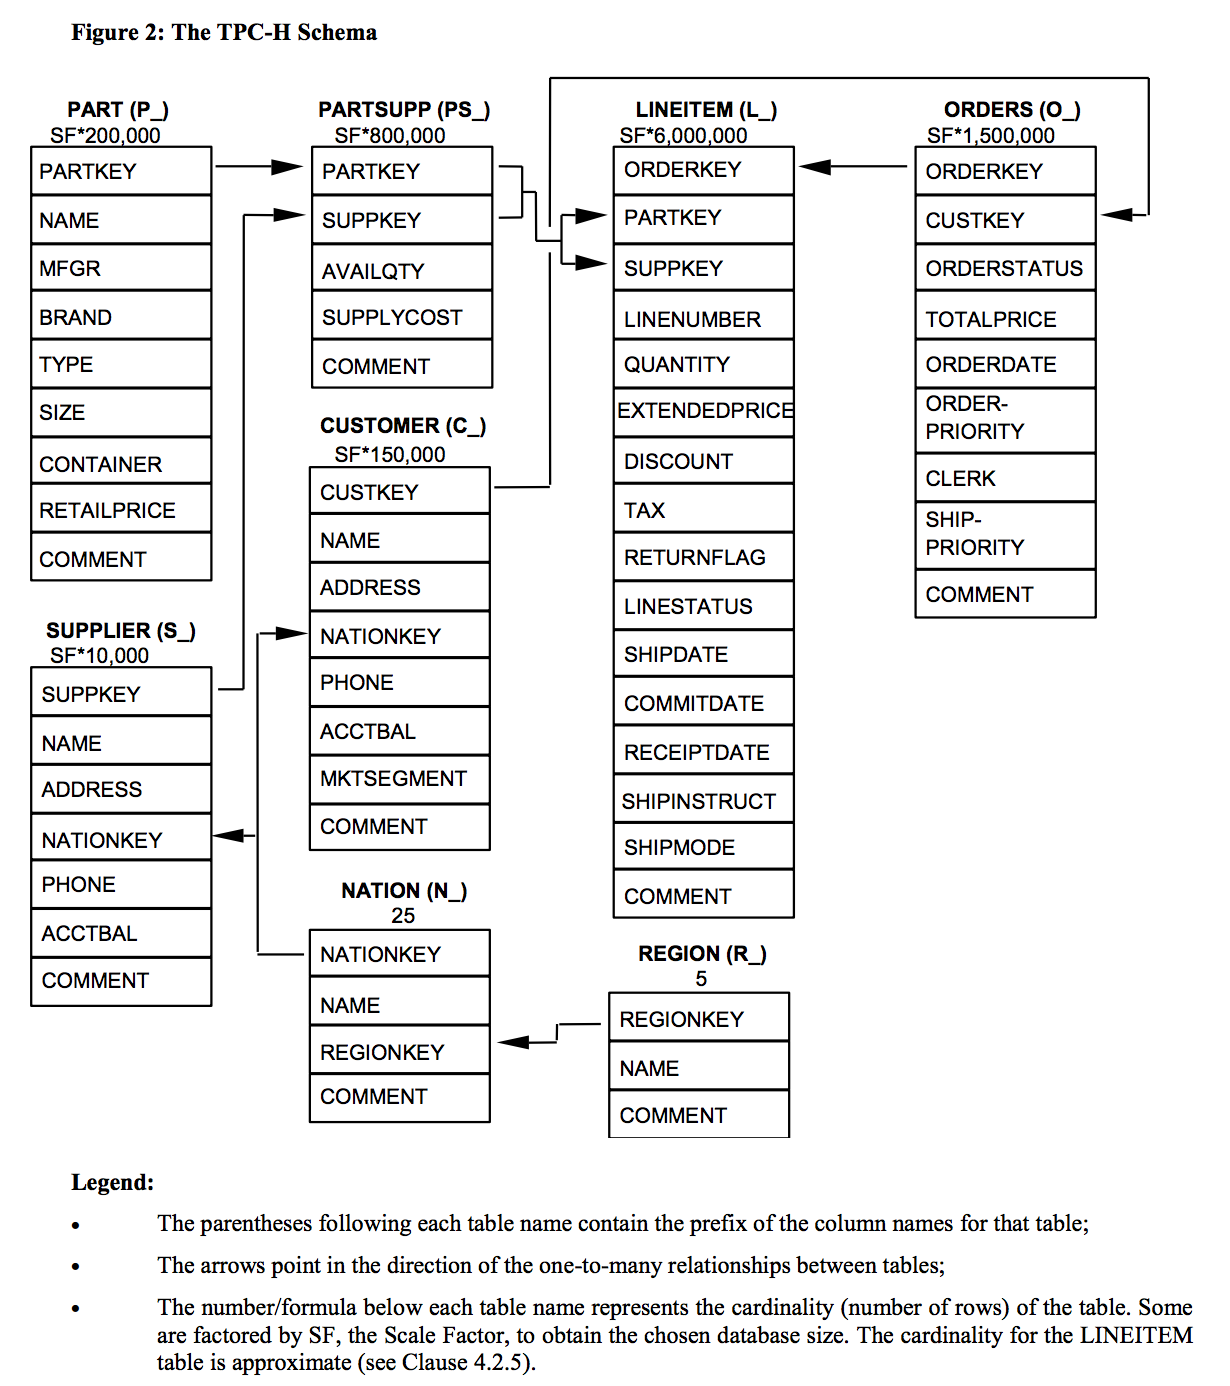
(source: TPC Benchmark H Standard Specification)
Query definitions
Each TPC-H query asks a business question and includes the corresponding query to answer the question. Some of the TPC-H queries are included in Snowflake’s Get Started tutorials.
This section describes one of the queries. For more information about TPC-H and all the queries that are involved, see the official TPC Benchmark H Standard Specification.
The TPC-H script, provided by Snowflake, contains the full list of TPC-H queries. You can save the file to your local file system for reference.
Q1: Pricing summary report query
This query reports the amount of business that was billed, shipped, and returned.
Business question
The Pricing Summary Report Query provides a summary pricing report for all line items that were shipped as of a given date. The date is within 60-120 days of the greatest ship date contained in the database.
Functional query definition
The query lists totals for extended price, discounted extended price, discounted extended price plus tax, average quantity, average extended price, and average discount. These aggregates are grouped by RETURNFLAG and LINESTATUS, and listed in ascending order of RETURNFLAG and LINESTATUS. A count of the number of line items in each group is included:
Recommendations
Use the following recommendations to explore the sample data and compare query performance across runs.
Set your database and schema
Set your session context to the sample database and to the schema for the scale factor you want to test. After you set the context, you can refer to the tables by name without qualifying them:
Tag your session
Set a query tag on your session so that you can easily find your queries later in Query History:
Run multiple passes
Run all 22 queries from the TPC-H script three times in succession (three passes), then repeat the full set of passes a couple of times to confirm that the results are consistent.
To make sure that each pass runs the query instead of returning a cached result, turn off the query result cache for your session:
Inspect the results
After your runs finish, open Query History in Snowsight and use the Duration column to inspect the elapsed time for each query. Filter by the query tag that you set to quickly find your TPC-H queries.
You can also query the QUERY_HISTORY view in the ACCOUNT_USAGE schema of the shared SNOWFLAKE database. Filter on the query tag that you set and review the TOTAL_ELAPSED_TIME column (in milliseconds) for each query:
Account usage views can have some latency, so recently completed queries might not appear right away.
Tip
To explore your query history conversationally, you can use Cortex Code, Snowflake’s AI coding agent, to write and refine these queries for you.
Run the queries on interactive tables and warehouses
Snowflake interactive tables and interactive warehouses are optimized for low-latency, high-concurrency queries. You can run the 22 TPC-H queries on interactive tables to compare their performance against standard tables.
Because the SNOWFLAKE_SAMPLE_DATA database is read-only, first copy the sample data into your own tables. To compare results, create two sets of tables: a standard set as a baseline and an interactive set. When you create the interactive tables, cluster each one on the column that the queries filter or join on most:
- LINEITEM: cluster by L_SHIPDATE.
- ORDERS: cluster by O_ORDERDATE.
- CUSTOMER, PART, PARTSUPP, SUPPLIER, NATION, and REGION: cluster by the primary key column.
Then create an interactive warehouse, attach the eight interactive tables, and set a standard warehouse as its fallback so that any query that exceeds the interactive query timeout reruns automatically. Run the TPC-H queries against the standard tables and the interactive tables separately, then compare the elapsed times.
For the full procedure, including how to create interactive tables and warehouses, configure a fallback warehouse, and follow benchmarking best practices such as turning off the result cache and waiting for the cache to warm, see Snowflake interactive tables and interactive warehouses and benchmarking best practices for interactive tables.