Sample Data: TPC-DS
TPC-DS is a benchmark that models a retail product supplier’s decision support system. It has customer, order, and product data. Snowflake provides 10TB and 100TB versions of TPC-DS data for you to explore, in schemas named TPCDS_SF10TCL and TPCDS_SF100TCL, respectively, within the SNOWFLAKE_SAMPLE_DATA shared database.
As described in the TPC Benchmark™ DS (TPC-DS) specification:
“In order to address the enormous range of query types and user behaviors encountered by a decision support system, TPC-DS utilizes a generalized query model. This model allows the benchmark to capture important aspects of the interactive, iterative nature of on-line analytical processing (OLAP) queries, the longer-running complex queries of data mining and knowledge discovery, and the more planned behavior of well known report queries.”
How Do I Add the TPC-DS Data Set to My Account?
You can access TPC-DS data sets that are provided by Snowflake directly from Snowflake Marketplace in Snowsight. See Getting TPC-DS data from Snowflake Marketplace. You can also access the list of TPC-DS queries by downloading this script.
Database Entities, Relationships, and Characteristics
The TPC-DS data set consists of 7 fact tables and 17 dimensions in the following schemas:
TPCDS_SF100TCL: The 100 TB (scale factor 100,000) version represents 100 million customers and over 500,000 items stored, with sales data spanning 3 channels — stores, catalogs, and the web — covering a period of 5 years. The largest table, STORE_SALES, contains nearly 300 billion rows, and the fact tables contain over 560 billion rows in total.
TPCDS_SF10TCL: The 10 TB (scale factor 10,000) version represents 65 million customers and over 400,000 items stored, with sales data spanning 3 channels — stores, catalogs, and the web — covering a period of 5 years. The largest table, STORE_SALES, contains nearly 29 billion rows, and the fact tables contain over 56 billion rows in total.
The relationships between facts and dimensions are represented through joins on surrogate keys. The detailed relationships are too numerous to display here, but can be found in the TPC-DS specification.
Query Definitions
TPC-DS contains a set of 99 queries with wide variation in complexity and range of data scanned. Each TPC-DS query asks a business question and includes the corresponding query to answer the question. We have generated samples of all 99 TPC-DS queries for you to explore. Alternatively, you can use the tools in the TPC-DS Benchmark Kit to generate many different versions of these queries that vary by parameter values.
Below, we describe just one of the queries. More information about TPC-DS and all the queries involved can be found in the official TPC-DS specification.
The TPC-DS script, provided by Snowflake, contains the full list of TPC-DS queries. You can save the file to your local file system for reference.
An Example: Catalog Sales Call Center Outliers (Q57)
This query looks at a year’s worth of CATALOG_SALES table data and reveals the categories and brands where sales in a month vary more than 10% from average for a given call center.
Business Question
Find the item brands and categories for each call center and their monthly sales figures for a specified year, where the monthly sales figure deviated more than 10% of the average monthly sales for the year, sorted by deviation and call center. Report the sales deviation from the previous and following months.
Functional Query Definition
The query lists the following totals:
Extended price
Discounted extended price
Discounted extended price plus tax
Average quantity
Average extended price
Average discount
These aggregates are grouped by RETURNFLAG and LINESTATUS and are listed in ascending order of RETURNFLAG and LINESTATUS. A count of the number of line items in each group is included:
use schema snowflake_sample_data.tpcds_sf10Tcl;

-- QID=TPC-DS_query57

with
v1 as(
  select i_category, i_brand,
         cc_name,
         d_year, d_moy,
         sum(cs_sales_price) sum_sales,
         avg(sum(cs_sales_price)) over
           (partition by i_category, i_brand, cc_name, d_year) avg_monthly_sales,
         rank() over (partition by i_category, i_brand, cc_name order by d_year, d_moy) rn
  from item, catalog_sales, date_dim, call_center
  where cs_item_sk = i_item_sk and
        cs_sold_date_sk = d_date_sk and
        cc_call_center_sk= cs_call_center_sk and
          (
            d_year = 2001 or
          ( d_year = 2001-1 and d_moy =12) or
          ( d_year = 2001+1 and d_moy =1)
          )
  group by i_category, i_brand,
           cc_name , d_year, d_moy),
v2 as(
  select v1.i_brand
    ,v1.d_year, v1.d_moy
    ,v1.avg_monthly_sales
    ,v1.sum_sales, v1_lag.sum_sales psum, v1_lead.sum_sales nsum
  from v1, v1 v1_lag, v1 v1_lead
  where v1.i_category = v1_lag.i_category and
    v1.i_category = v1_lead.i_category and
    v1.i_brand = v1_lag.i_brand and
    v1.i_brand = v1_lead.i_brand and
    v1.cc_name = v1_lag. cc_name and
    v1.cc_name = v1_lead. cc_name and
    v1.rn = v1_lag.rn + 1 and
    v1.rn = v1_lead.rn - 1)
select  *
from v2
where d_year = 2001 and
  avg_monthly_sales > 0 and
  case when avg_monthly_sales > 0
       then abs(sum_sales - avg_monthly_sales) / avg_monthly_sales
       else null
       end > 0.1
order by sum_sales - avg_monthly_sales, nsum
limit 100;
Getting TPC-DS data from Snowflake Marketplace
You can access TPC-DS data directly by going to Snowflake Marketplace in Snowsight. You can create and query your own instance of the following data sets:
TPC-DS 10 TB (standard table format)
TPC-DS 10 TB Managed Iceberg (Iceberg table format)
The data in the Managed Iceberg data set is physically stored in Iceberg format, rather than the Snowflake proprietary table format. You can get both data sets and compare the behavior of the two formats.
To get these data sets:
Search for TPC-DS in Snowflake Marketplace. (Log in to Snowsight if prompted.)
Select one of the TPC-DS data sets.
Select Get.
Request access from your administrator if necessary. Your login role might not have access to these data sets.
Under Options, give your TPC-DS database a user-defined name and select the role that you will use to access it. Alternatively, proceed with the default selections.
Select Get it for Free.
In a few seconds, you should see the following pop-up window, which indicates that your instance of the TPC-DS database has been created and is available to inspect and query.
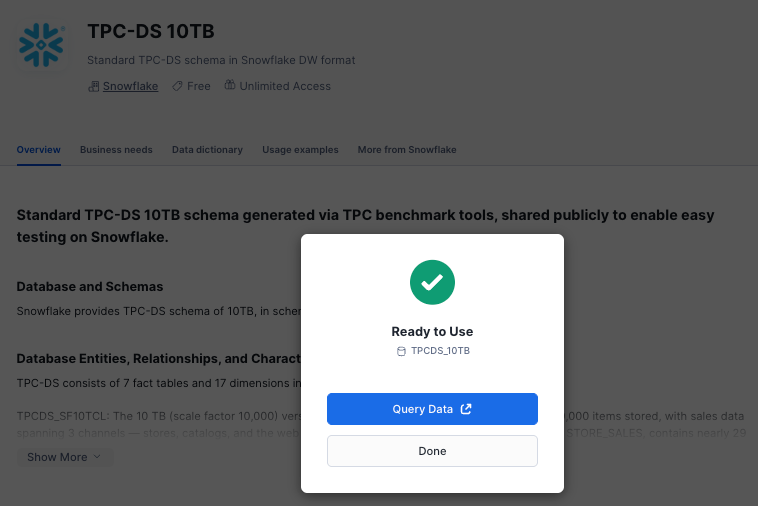
Select Query Data.
Query the data in the database, using either the worksheet provided or the
TPC-DS script, which contains all of the queries.
If you have already used Get to create one of these databases, you can go to it by selecting Open on the Marketplace search results.