Monitor dynamic tables
This topic covers the following information for monitoring your dynamic tables:
Section |
Description |
---|---|
An overview of the dynamic tables INFORMATION_SCHEMA table functions. |
|
How to view the refresh status for all your dynamic tables. |
|
Understanding why your refreshes are being skipped, slow, or failing to help you troubleshoot. |
|
Examine dynamic table graphs to visualize dependencies. |
|
How to query an event table that provides information about your refresh status. |
|
(Preview) How to set up alerts on new data in an event table. |
Call the table functions for dynamic tables
Use the following INFORMATION_SCHEMA table functions to monitor your dynamic tables:
DYNAMIC_TABLES: Returns metadata about your dynamic tables, including aggregate lag metrics and the status of the most recent refreshes, within seven days of the current time.
DYNAMIC_TABLE_REFRESH_HISTORY: Returns information about each completed and running refresh of your dynamic tables, including refresh status and trigger, and the target lag.
DYNAMIC_TABLE_REFRESH_HISTORY view: This Account Usage view also displays information for dynamic table refresh history. It is useful for debugging issues that are for longer than the DYNAMIC_TABLE_REFRESH_HISTORY table function’s data retention time (seven days).
DYNAMIC_TABLE_GRAPH_HISTORY: Returns information that provides the history of each dynamic table, its properties, and its dependencies on other tables and dynamic tables.
You can use this table function to get a snapshot of the dependency tree of dynamic tables at a given point in time.
The output also reflects the changes made to the properties of a dynamic table over time. Each row represents a dynamic table and a specific set of properties. If you change a property of a dynamic table (for example, the target lag), the function returns the most up to date property.
Monitor the refreshes for all your dynamic tables
You can use Snowsight or the DYNAMIC_TABLES table function to view the refresh status for all your dynamic tables.
Sign in to Snowsight. In the navigation menu, select Monitoring » Dynamic Tables.
You can view the state and last refresh status for your dynamic tables on this page. You can also filter by database or schema to narrow the results.
DYNAMIC_TABLES provides information about all of the dynamic tables in your account.
The following example retrieves the information about the state and target lag for all dynamic tables in the account and their associated database and schema.
SELECT
name,
database_name,
schema_name,
scheduling_state,
target_lag_type,
target_lag_sec,
FROM
TABLE (
INFORMATION_SCHEMA.DYNAMIC_TABLES ()
)
ORDER BY
name;
+--------------------+------------------------------+--------------------------------------------------------------------------------------------------+-----------------+----------------+
| NAME | DATABASE_NAME | SCHEMA_NAME | SCHEDULING_STATE | TARGET_LAG_TYPE | TARGET_LAG_SEC |
|--------------------+------------------------------+--------------------------------------------------------------------------------------------------|-----------------+----------------+
| MY_DYNAMIC_TABLE_1 | MY_DB_1 | MY_SCHEMA_1 | { | | |
| | | | "reason_code": "UPSTREAM_SUSPENDED_DUE_TO_ERRORS", | | |
| | | | "reason_message": "The DT was suspended because an input DT had 5 consecutive refresh errors", | | |
| | | | "state": "SUSPENDED", | | |
| | | | "suspended_on": "2025-04-14 11:49:09.576 Z" | USER_DEFINED | 60 |
| | | | } | | |
| MY_DYNAMIC_TABLE_2 | MY_DB_2 | MY_SCHEMA_2 | null | | |
+--------------------+------------------------------+--------------------------------------------------------------------------------------------------+-----------------+----------------|
The following example retrieves the state and information about each state for refresh for all dynamic tables in the account.
-- latest_data_timestamp is the refresh timestamp associated with last successful refresh.
SELECT
name,
last_completed_refresh_state,
last_completed_refresh_state_code,
last_completed_refresh_state_message,
latest_data_timestamp,
time_within_target_lag_ratio,
maximum_lag_sec,
executing_refresh_query_id
FROM
TABLE (
INFORMATION_SCHEMA.DYNAMIC_TABLES ()
)
ORDER BY
name;
-- Both dynamic tables in the example below have a target lag of one minute.
+--------------------+------------------------------+-----------------------------------+-----------------------------------------------+-----------------------+------------------------------+-----------------+----------------------------+
| NAME | LAST_COMPLETED_REFRESH_STATE | LAST_COMPLETED_REFRESH_STATE_CODE | LAST_COMPLETED_REFRESH_STATE_MESSAGE | LATEST_DATA_TIMESTAMP | TIME_WITHIN_TARGET_LAG_RATIO | MAXIMUM_LAG_SEC | EXECUTING_REFRESH_QUERY_ID |
|--------------------+------------------------------+-----------------------------------+-----------------------------------------------|-----------------------+------------------------------+-----------------+----------------------------+
| MY_DYNAMIC_TABLE_1 | UPSTREAM_FAILED | UPSTREAM_FAILURE | Skipped refreshing because an input DT failed | 2025-04-12 09:00:48 | null | null | null |
| MY_DYNAMIC_TABLE_2 | SUCCEEDED | SUCCESS | null | 2025-04-12 09:01:36 | 0.999 | 125 | null |
+--------------------+------------------------------+-----------------------------------+-----------------------------------------------+-----------------------+------------------------------+-----------------+----------------------------+
Monitor all the refreshes for a specific dynamic table
You can use Snowsight or the DYNAMIC_TABLES_REFRESH_HISTORY table function to view the refresh history for a given dynamic table.
Sign in to Snowsight.
In the navigation menu, select Monitoring » Dynamic Tables.
Select your dynamic table and then go to the Refresh History tab.
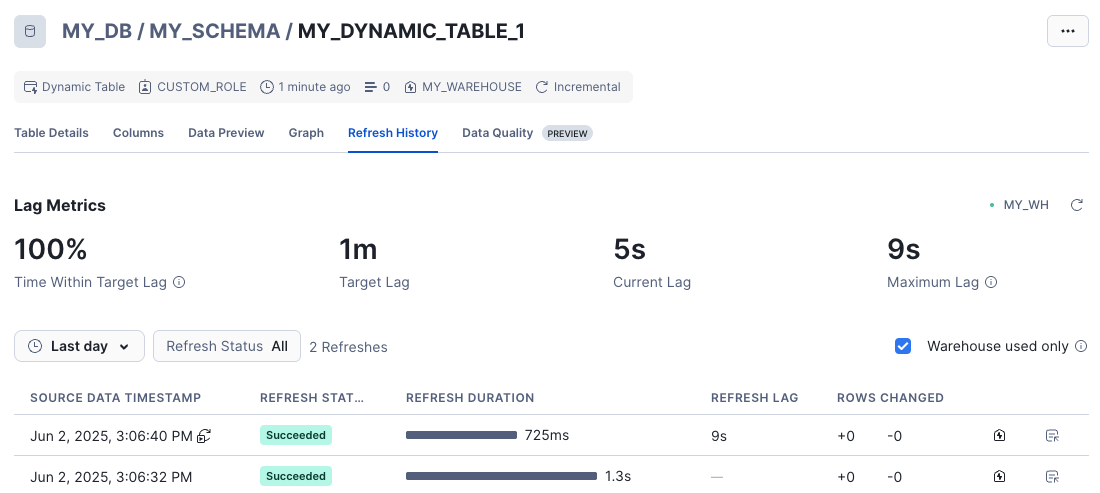
This page displays your dynamic table’s refresh history, which includes information about each refresh’s status, duration, and actual lag time, and the number of rows changed with each refresh.
It also displays your dynamic table’s lag metrics, which includes the percentage of the time within the target lag and the longest actual lag time during the given interval.
To view the refresh history for a specific dynamic table, use the DYNAMIC_TABLE_REFRESH_HISTORY table function.
For example, if you want to view the refresh history for all the dynamic tables in the my_db
database and my_schema
schema, execute
the following statement:
SELECT
name,
data_timestamp,
state,
state_code,
state_message
FROM TABLE (INFORMATION_SCHEMA.DYNAMIC_TABLE_REFRESH_HISTORY (NAME_PREFIX => 'MY_DB.MY_SCHEMA')) ORDER BY data_timestamp desc;
+--------------------+---------------------+-----------+------------------------------+----------------------------------------------------------------+
| NAME | DATA_TIMESTAMP | STATE | STATE_CODE | STATE_MESSAGE |
|--------------------+---------------------+-----------+------------------------------+----------------------------------------------------------------|
| MY_DYNAMIC_TABLE_1 | 2025-04-12 09:01:36 | SKIPPED | SKIP_DUE_TO_UPSTREAM_FAILURE | Skipped refreshing because an input DT failed. |
| MY_DYNAMIC_TABLE_1 | 2025-04-12 09:00:48 | SUCCEEDED | | |
| MY_DYNAMIC_TABLE_1 | 2025-04-12 09:00:00 | FAILED | 100038 | Numeric value 'Good' is not recognized. |
| MY_DYNAMIC_TABLE_2 | 2025-04-12 09:01:36 | SUCCEEDED | | |
| MY_DYNAMIC_TABLE_2 | 2025-04-12 09:00:48 | FAILED | 091930 | SQL compilation error: Change tracking is not enabled or has |
| | | | | been missing for the time range requested on table 'MY_TABLE'. |
| MY_DYNAMIC_TABLE_2 | 2025-04-12 09:00:00 | CANCELLED | 002724 | Dynamic Table refresh job cancelled. |
+--------------------+---------------------+-----------+------------------------------+----------------------------------------------------------------+
To filter for refreshes that had errors, pass in the argument ERROR_ONLY => TRUE
. For example:
SELECT
name,
data_timestamp,
state,
state_code,
state_message
FROM TABLE (INFORMATION_SCHEMA.DYNAMIC_TABLE_REFRESH_HISTORY (NAME_PREFIX => 'MY_DB.MY_SCHEMA', ERROR_ONLY => TRUE));
+--------------------+---------------------+-----------+------------------------------+----------------------------------------------------------------+
| NAME | DATA_TIMESTAMP | STATE | STATE_CODE | STATE_MESSAGE |
|--------------------+---------------------+-----------+------------------------------+----------------------------------------------------------------|
| MY_DYNAMIC_TABLE_1 | 2025-04-12 09:00:00 | FAILED | 100038 | Numeric value 'Good' is not recognized. |
| MY_DYNAMIC_TABLE_2 | 2025-04-12 09:00:48 | FAILED | 091930 | SQL compilation error: Change tracking is not enabled or has |
| | | | | been missing for the time range requested on table 'MY_TABLE'. |
| MY_DYNAMIC_TABLE_2 | 2025-04-12 09:00:00 | CANCELLED | 002724 | Dynamic Table refresh job cancelled. |
+--------------------+---------------------+-----------+------------------------------+----------------------------------------------------------------+
Monitor and troubleshoot skipped, slow, or failed refreshes
When monitoring your dynamic table refreshes, note the following:
If you see many SKIPPED entries, see Skipped refreshes.
If you see consistent FAILED entries, see the Slow or failed refreshes.
If you see a SCHEDULED or EXECUTING entry stuck for a long time, see Slow or failed refreshes.
Skipped refreshes
Dynamic tables refresh on a schedule. When a scheduled refresh starts, the following situations might cause the refresh to skip:
If the dynamic table being refreshed has another dynamic table upstream, and the refresh for the upstream failed or was skipped.
If a previous refresh for the dynamic table is still running.
If the dynamic table’s refresh often takes longer than the target lag or there’s a significant difference between the target and actual lag, Snowflake might skip a refresh to reduce the rate of future skips.
For instance, if a dynamic table has a 1-minute target lag but typically takes one hour to refresh, the system adjusts the “actual lag” accordingly.
Manual refreshes are never skipped but they can cause other scheduled refreshes to skip, especially if you perform frequent manual refreshes on a dynamic table. Doing so can prevent downstream dynamic tables from refreshing. For this reason, Snowflake recommends that you avoid frequently performing manual refreshes on a dynamic table with downstream dynamic tables that are expected to refresh according to target lag.
Slow or failed refreshes
Dynamic table refresh performance relies on specific assumptions about the workload or data it’s handling. Refresh failures are typically due to issues with the dynamic table’s query definition, input data (for example, parsing errors), or internal system issues.
For slow refreshes, use the Refresh History page in Snowsight to visualize changes and spot outliers in your dynamic tables’ refresh duration:

For failed refreshes, use the Refresh History page to determine whether the refresh failure is from delayed updates or data inconsistency. The Source Data Timestamp column displays the time that was updated by the last successful refresh. A failed refresh doesn’t advance this value. If this value is far behind relative to the target lag specified, it indicates that your dynamic table is lagging behind.
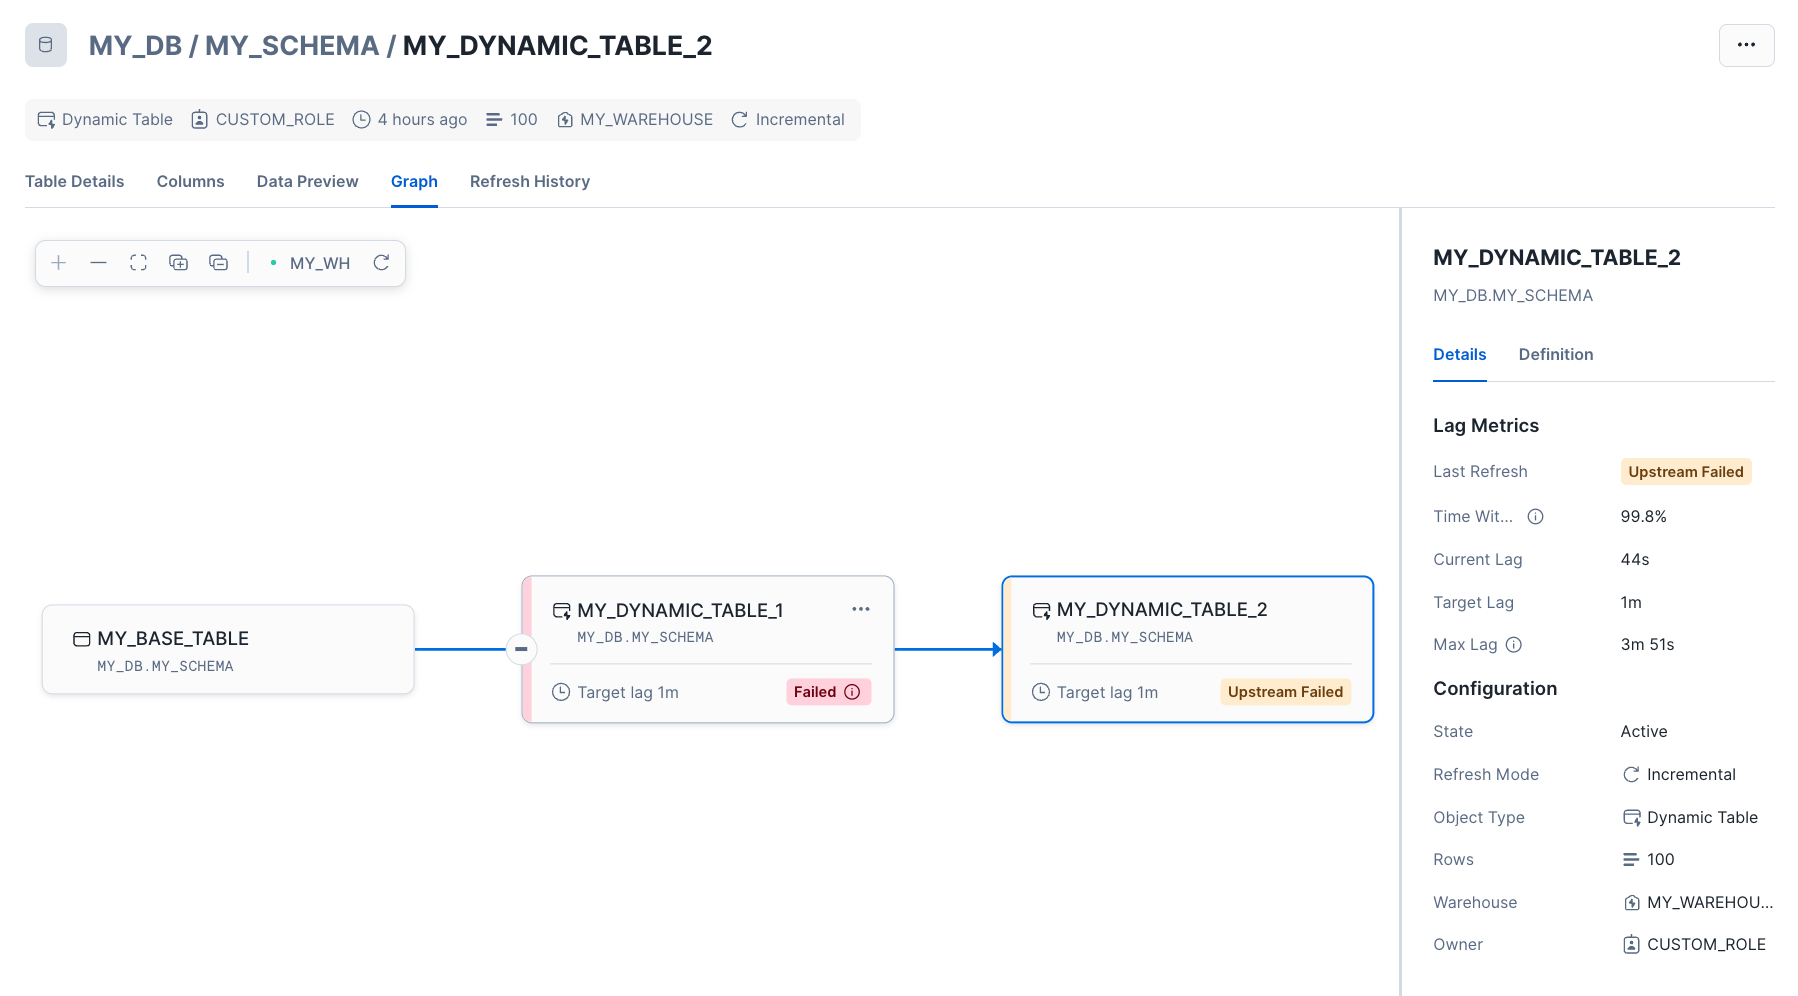
Additionally, you can use the Graph view in Snowsight to troubleshoot by visualizing the dependencies of your dynamic tables. A failed or suspended upstream dynamic table would automatically cause its downstream dynamic tables’ refresh to fail. For more information, see Use Snowsight to examine the graph of dynamic tables (below).
Use Snowsight to examine the graph of dynamic tables
Viewing dependencies is particularly useful for troubleshooting dynamic table chains. In Snowsight, you can visualize which dynamic tables a given dynamic table depends on using the lineage graph. For example, you can identify the following:
Upstream dependencies where a dynamic table pulls data from.
Downstream dependencies that might be impacted by changes to a dynamic table.
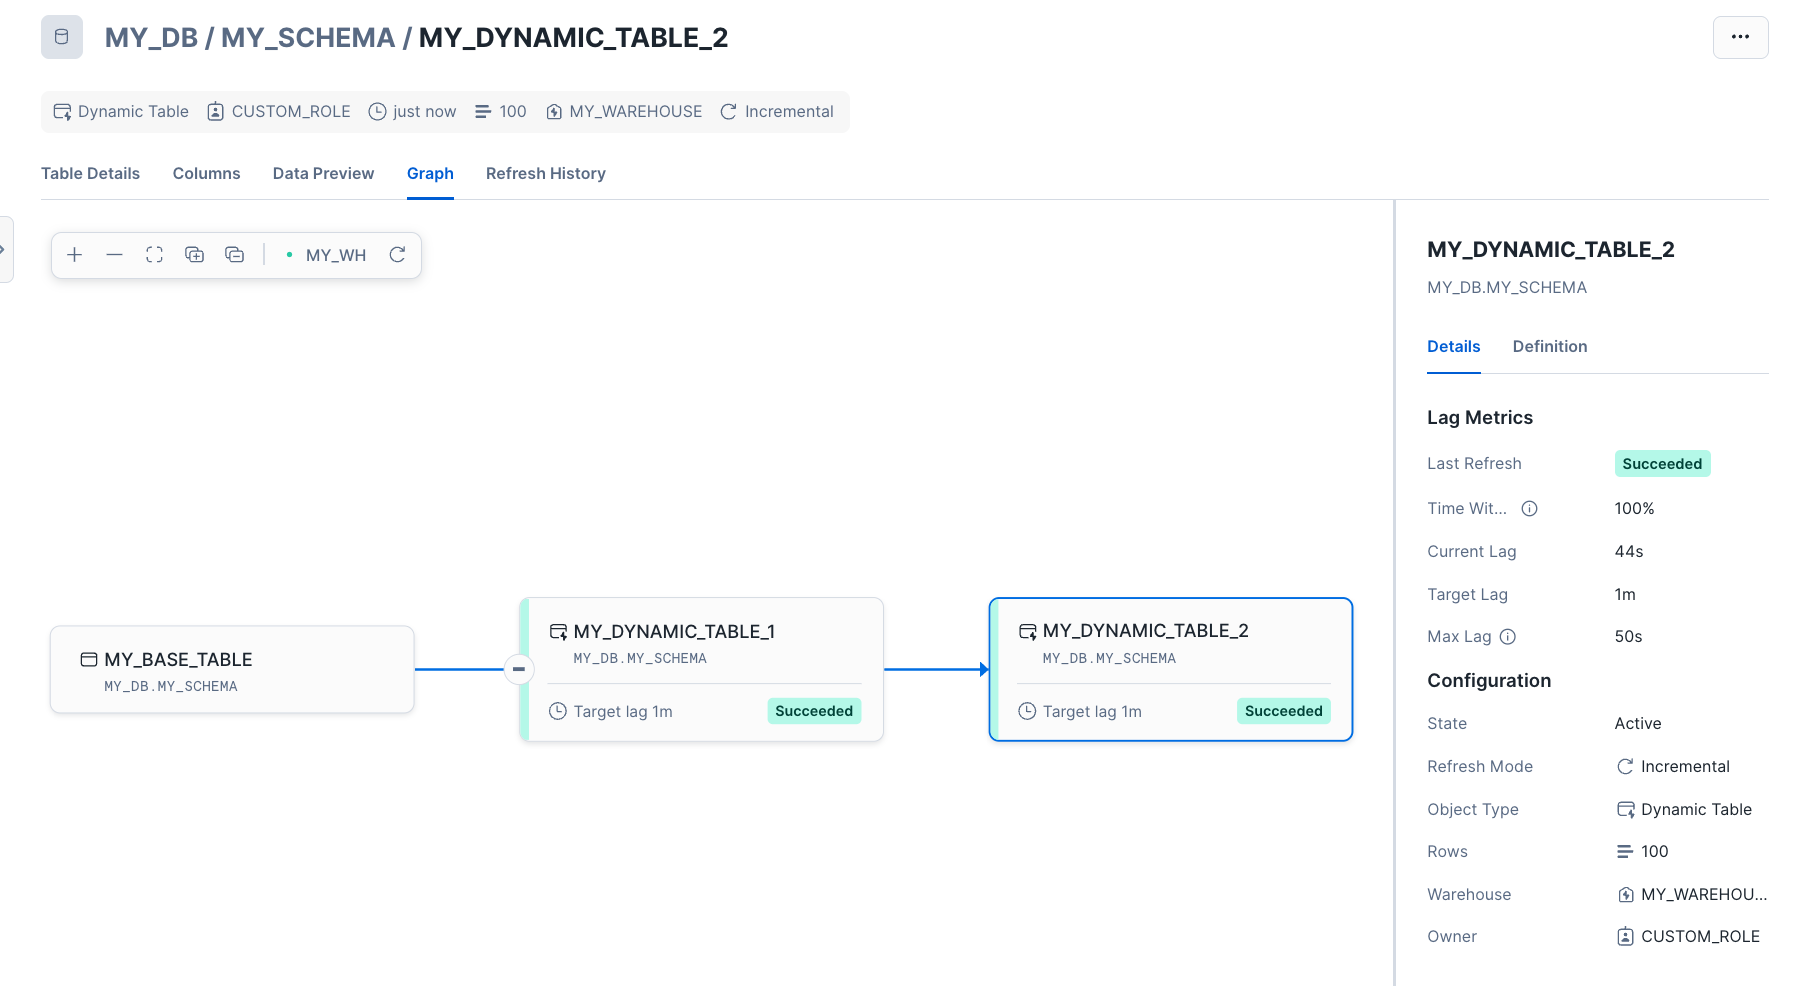
Dependencies can impact refresh performance. For example, suppose your dynamic table’s upstream table has a large data load added just before its scheduled refresh. Your dynamic table will wait for it to finish the refresh, causing it to miss its target lag. In the lineage graph, you’d see the input table marked as “executing,” indicating the delay.
To view the graph of a particular dynamic table, do the following:
Sign in to Snowsight.
In the navigation menu, go to Monitoring » Dynamic Tables.
Select your dynamic table. The Graph view is displayed by default. This displays the graph with the node for the dynamic table selected. The Details pane on the right displays information about its lag metrics and configuration.
To display the details of a different table in the graph, select that table.
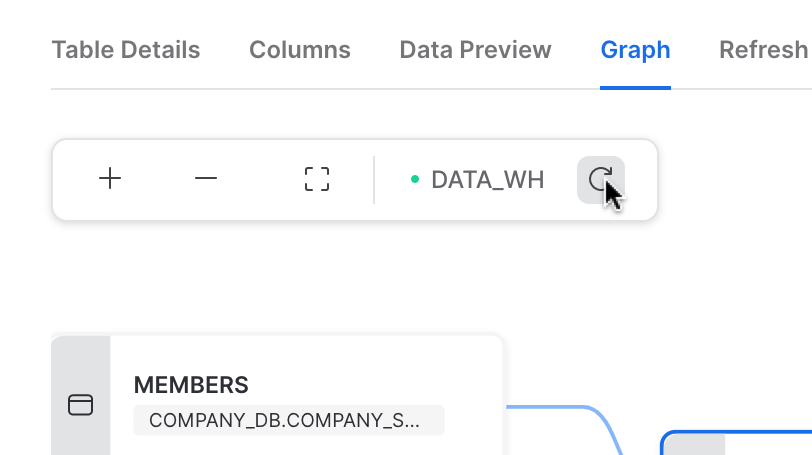
To update the graph, select the refresh button in the bar above the graph.
If a refresh failed due to an UPSTREAM_FAILED error code, you can use the graph to visualize which upstream table caused the failure.
To view the full details of a table in the graph, see List and view information about dynamic tables.
Query the event table to monitor refreshes
When a dynamic table is refreshed, you can configure Snowflake to record an event that provides information about the status of the refresh operation. The event is recorded in the active event table associated with the dynamic table.
For example, suppose that you have associated an event table with a database. When a dynamic table in that database is refreshed, Snowflake records an event to that event table.
You can query the events logged in this active event table to monitor your dynamic table refreshes.
For example, to get the timestamp, dynamic table name, query ID, and error message for errors with dynamic tables in the database my_db
,
do the following:
SELECT
timestamp,
resource_attributes:"snow.executable.name"::VARCHAR AS dt_name,
resource_attributes:"snow.query.id"::VARCHAR AS query_id,
value:message::VARCHAR AS error
FROM my_event_table
WHERE
resource_attributes:"snow.executable.type" = 'DYNAMIC_TABLE' AND
resource_attributes:"snow.database.name" = 'MY_DB' AND
value:state = 'FAILED'
ORDER BY timestamp DESC;
+-------------------------+------------------+--------------------------------------+---------------------------------------------------------------------------------+
| TIMESTAMP | DT_NAME | QUERY_ID | ERROR |
|-------------------------+------------------+--------------------------------------+---------------------------------------------------------------------------------|
| 2025-02-17 21:40:45.444 | MY_DYNAMIC_TABLE | 01ba7614-0107-e56c-0000-a995024f304a | SQL compilation error: |
| | | | Failure during expansion of view 'MY_DYNAMIC_TABLE': SQL compilation error: |
| | | | Object 'MY_DB.MY_SCHEMA.MY_BASE_TABLE' does not exist or not authorized. |
+-------------------------+------------------+--------------------------------------+---------------------------------------------------------------------------------+
The following example retrieves all columns for upstream errors with dynamic tables in the schema my_schema
:
SELECT *
FROM my_event_table
WHERE
resource_attributes:"snow.executable.type" = 'DYNAMIC_TABLE' AND
resource_attributes:"snow.schema.name" = 'MY_SCHEMA' AND
value:state = 'UPSTREAM_FAILURE'
ORDER BY timestamp DESC;
+-------------------------+-----------------+-------------------------+-------+----------+-------------------------------------------------+-------+------------------+-------------+-----------------------------+-------------------+-------------------------------+-----------+
| TIMESTAMP | START_TIMESTAMP | OBSERVED_TIMESTAMP | TRACE | RESOURCE | RESOURCE_ATTRIBUTES | SCOPE | SCOPE_ATTRIBUTES | RECORD_TYPE | RECORD | RECORD_ATTRIBUTES | VALUE | EXEMPLARS |
|-------------------------+-----------------+-------------------------+-------+----------+-------------------------------------------------+-------+------------------+-------------+-----------------------------+-------------------+-------------------------------+-----------|
| 2025-02-17 21:40:45.486 | NULL | 2025-02-17 21:40:45.486 | NULL | NULL | { | NULL | NULL | EVENT | { | NULL | { | NULL |
| | | | | | "snow.database.id": 49, | | | | "name": "refresh.status", | | "state": "UPSTREAM_FAILURE" | |
| | | | | | "snow.database.name": "MY_DB", | | | | "severity_text": "WARN" | | } | |
| | | | | | "snow.executable.id": 487426, | | | | } | | | |
| | | | | | "snow.executable.name": "MY_DYNAMIC_TABLE_2", | | | | | | | |
| | | | | | "snow.executable.type": "DYNAMIC_TABLE", | | | | | | | |
| | | | | | "snow.owner.id": 2601, | | | | | | | |
| | | | | | "snow.owner.name": "DATA_ADMIN", | | | | | | | |
| | | | | | "snow.owner.type": "ROLE", | | | | | | | |
| | | | | | "snow.schema.id": 411, | | | | | | | |
| | | | | | "snow.schema.name": "MY_SCHEMA" | | | | | | | |
| | | | | | } | | | | | | | |
+-------------------------+-----------------+-------------------------+-------+----------+-------------------------------------------------+-------+------------------+-------------+-----------------------------+-------------------+-------------------------------+-----------+
For information about the role that you need to use to query the event table and the conditions that you can use to filter the results, see Set up an alert on new data.
Set up alerts on new data to monitor refreshes
As mentioned earlier, when a dynamic table is refreshed, an event is logged in the event table to indicate whether the refresh succeeded or failed. You can set up an alert on new data to monitor the event table. You can configure the alert to send a notification when a refresh fails.
The next sections explain how to set up the event logging to capture the events, how to set up the alert, and how to interpret the events recorded in the event table:
Note
Logging events for dynamic tables incurs costs. See Costs of telemetry data collection.
Set the severity level of the events to capture
Note
If you do not set the severity level, no events will be captured.
To set up dynamic table events to be recorded to the event table, set the severity level of events that you want captured in the event table. Events are captured at the following levels:
ERROR
: Refresh failure events.WARN
: Failures to refresh upstream dynamic tables and refresh failure events.INFO
: Successful refresh events, failures to refresh upstream dynamic tables, and refresh failure events.
To set the level, set the LOG_LEVEL parameter for the account or object. You can set the level for:
All objects in the account.
All objects in a database or schema.
A specific dynamic table.
For example:
To capture ERROR-level events and messages for all objects in the account, execute ALTER ACCOUNT SET LOG_LEVEL:
ALTER ACCOUNT SET LOG_LEVEL = ERROR;
Note that this level affects all types of objects in the account, including UDFs, stored procedures, dynamic tables, and tasks.
To capture INFO-level events and messages for all objects in the database
my_db
, execute ALTER DATABASE … SET LOG_LEVEL:ALTER DATABASE my_db SET LOG_LEVEL = INFO;
Similar to the case of setting the level on the account, setting the level on the database affects all types of objects in the database, including UDFs, stored procedures, dynamic tables, and tasks.
To capture WARN-level events for the dynamic table
my_dynamic_table
, execute ALTER DYNAMIC TABLE … SET LOG_LEVEL:ALTER DYNAMIC TABLE my_dynamic_table SET LOG_LEVEL = WARN;
Set up an alert on new data
After you set the severity level for logging events, you can set up an alert on new data to monitor the event table for new events that indicate a failure in a dynamic table refresh. An alert on new data is triggered when new rows in the event table are inserted and meet the condition specified in the alert.
Note
To create the alert on new data, you must use a role that has been granted the required privileges to query the event table.
If the alert condition queries the default event table (SNOWFLAKE.TELEMETRY.EVENTS) or the predefined view (SNOWFLAKE.TELEMETRY.EVENTS_VIEW view), see Roles for access to the default event table and EVENTS_VIEW.
To manage access to the EVENTS_VIEW view, see Manage access to the EVENTS_VIEW view.
If the alert condition queries a custom event table, see Access control privileges for event tables.
To manage access to a custom event table, see Managing access to event table data.
In the alert condition, to query for dynamic table events, select rows where
resource_attributes:"snow.executable.type" = 'DYNAMIC_TABLE'
. To narrow down the list of events, you can filter on the
following columns:
To restrict the results to dynamic tables in a specific database, use
resource_attributes:"snow.database.name"
.To return events where the refresh failed due to an error with the dynamic table, use
value:state = 'FAILED'
.To return events where the refresh failed due to an error with an upstream dynamic table, use
value:state = 'UPSTREAM_FAILURE'
.
For information on the values logged for a dynamic table event, see Information logged for dynamic table events.
For example, the following statement creates an alert on new data that performs an action when refreshes fail for dynamic tables
in the database my_db
. The example assumes that:
Your active event table is the default event table (SNOWFLAKE.TELEMETRY.EVENTS).
You have set up a webhook notification integration for that Slack channel.
CREATE ALERT my_alert_on_dt_refreshes
IF( EXISTS(
SELECT * FROM SNOWFLAKE.TELEMETRY.EVENT_TABLE
WHERE resource_attributes:"snow.executable.type" = 'dynamic_table'
AND resource_attributes:"snow.database.name" = 'my_db'
AND record_attributes:"event.name" = 'refresh.status'
AND record:"severity_text" = 'ERROR'
AND value:"state" = 'FAILED'))
THEN
BEGIN
LET result_str VARCHAR;
(SELECT ARRAY_TO_STRING(ARRAY_ARG(name)::ARRAY, ',') INTO :result_str
FROM (
SELECT resource_attributes:"snow.executable.name"::VARCHAR name
FROM TABLE(RESULT_SCAN(SNOWFLAKE.ALERT.GET_CONDITION_QUERY_UUID()))
LIMIT 10
)
);
CALL SYSTEM$SEND_SNOWFLAKE_NOTIFICATION(
SNOWFLAKE.NOTIFICATION.TEXT_PLAIN(:result_str),
'{"my_slack_integration": {}}'
);
END;
Information logged for dynamic table events
When a dynamic table refreshes, an event is logged to the event table. The following sections describe the event table row that represents the event:
Event table column values
When a dynamic table refreshes, a row with the following values is inserted into the event table.
Note
If a column is not listed below, the column value is NULL for the event.
Column |
Data type |
Description |
---|---|---|
|
TIMESTAMP_NTZ |
The UTC timestamp when an event was created. |
|
TIMESTAMP_NTZ |
A UTC time used for logs. Currently, this is the same value that is in the |
|
OBJECT |
Attributes that identify the dynamic table that was refreshed. |
|
STRING |
The event type, which is |
|
OBJECT |
Details about the status of the dynamic table refresh. |
|
VARIANT |
The status of the dynamic table refresh and, if the refresh failed, the error message for the failure. |
Key-value pairs in the resource_attributes
column
The resource_attributes
column contains an OBJECT value with the following key-value pairs:
Attribute name |
Attribute type |
Description |
Example |
---|---|---|---|
|
INTEGER |
The internal/system-generated identifier of the database containing the dynamic table. |
|
|
VARCHAR |
The name of the database containing the dynamic table. |
|
|
INTEGER |
The internal/system-generated identifier of the dynamic table that was refreshed. |
|
|
VARCHAR |
The name of the dynamic table that was refreshed. |
|
|
VARCHAR |
The type of the object. The value is |
|
|
INTEGER |
The internal/system-generated identifier of the role with the OWNERSHIP privilege on the dynamic table. |
|
|
VARCHAR |
The name of the role with the OWNERSHIP privilege on the dynamic table. |
|
|
VARCHAR |
The type of role that owns the object, for example |
|
|
VARCHAR |
ID of the query that refreshed the dynamic table. |
|
|
INTEGER |
The internal/system-generated identifier of the schema containing the dynamic table. |
|
|
VARCHAR |
The name of the schema containing the dynamic table. |
|
|
INTEGER |
The internal/system-generated identifier of the warehouse used to refresh the dynamic table. |
|
|
VARCHAR |
The name of the warehouse used to refresh the dynamic table. |
|
Key-value pairs in the record
column
The record
column contains an OBJECT value with the following key-value pairs:
Key |
Type |
Description |
Example |
---|---|---|---|
|
VARCHAR |
The name of the event. The value is |
|
|
VARCHAR |
The severity level of the event, which is one of the following values:
|
|
Key-value pairs in the value
column
The value
column contains an VARIANT value with the following key-value pairs:
Key |
Type |
Description |
Example |
---|---|---|---|
|
VARCHAR |
The state of the refresh, which can be one of the following values:
|
|
|
VARCHAR |
If the value in |
|