Monitoring Snowpark Connect for Spark workloads
Snowpark Connect for Spark uses Python’s standard logging module for diagnostics. When running workloads through
snowpark-submit, logs are
written to your account’s
event table, giving you full
SQL-queryable access to server and client output.
Log levels
Snowpark Connect for Spark emits logs at two primary levels:
INFOSummarizes high-level operations: session creation, query execution, UDF registration, and configuration changes. This is the default and is sufficient for most monitoring.
DEBUGAdds detailed internal state: generated SQL, plan translation steps, gRPC message details, and cache decisions. Use this level when you need to inspect the exact queries sent to Snowflake or diagnose unexpected behavior.
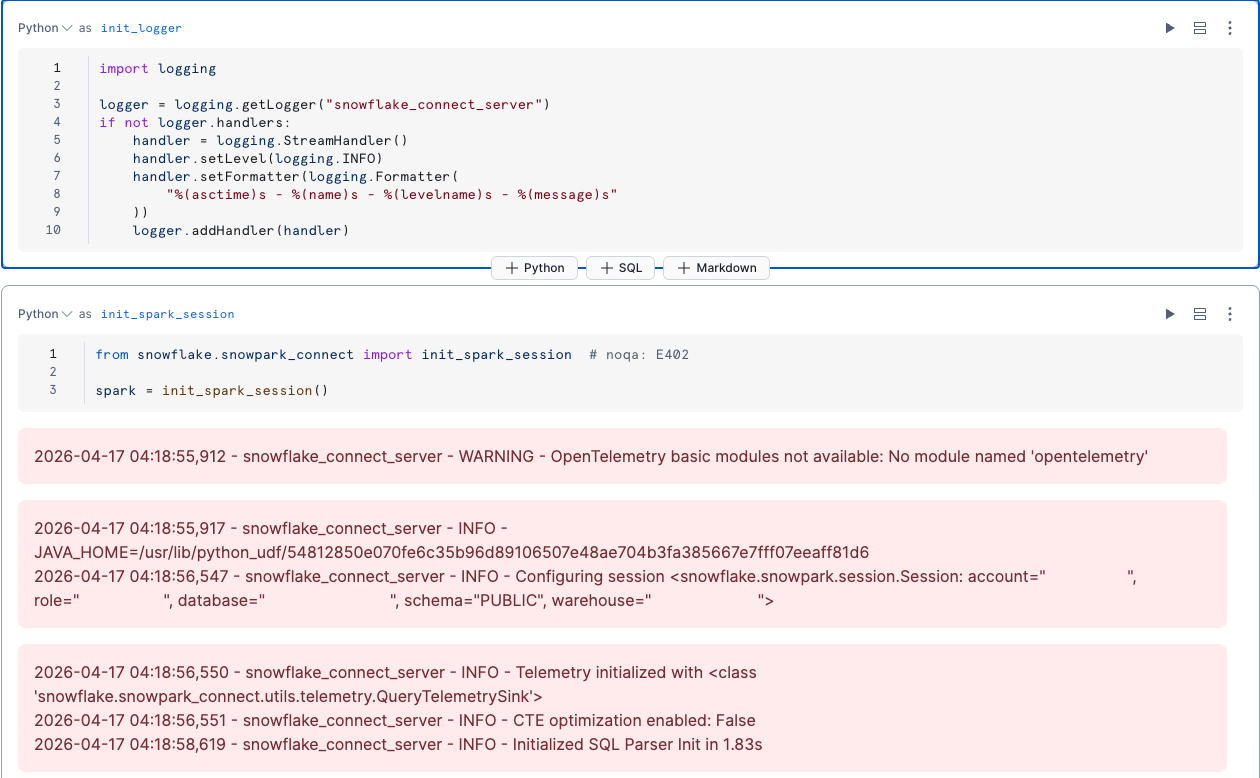
Configuring log output for local and notebook environments
When running the Snowpark Connect for Spark server locally (through init_spark_session), configure the logger
before importing and starting the session:
Snowflake Notebooks don’t display Python log output by default. To see Snowpark Connect for Spark logs in the
notebook cell output, attach a StreamHandler to the logger:
Event table logs for Snowpark Submit
When you run workloads through snowpark-submit, the SCOS server and client containers write logs, OpenTelemetry spans, and resource metrics to your account’s event table. This is the primary way to monitor production workloads.
Prerequisites
-
An event table configured in your account. Verify with:
For setup instructions, see Event table overview.
Note
Database-level event tables are not supported. Logs from Snowpark Submit workloads are written only to the account-level event table.
Retrieving logs via the CLI
Use the --workload-status and --display-logs flags to retrieve logs from a completed or
running job. The full workload name (with a UTC timestamp suffix) is printed when you submit:
Querying logs with SQL
For full control over filtering and analysis, query the event table directly.
Get all log lines for a job:
Tip
Always include a timestamp range. The event table can have millions of rows per day; without a time bound, queries are very slow or time out.
Filter by container:
Each job has two containers: server (SCOS internals, SQL execution) and client (your
PySpark app output).
Filter by severity:
Available severity values: DEBUG, INFO, WARN, and None (unstructured output that
doesn’t go through Python’s logging module).
Viewing generated queries in Snowsight
Every SQL statement that Snowpark Connect for Spark sends to Snowflake is visible in the Snowsight query history. To find queries from your workload:
- Sign in to Snowsight and go to Monitoring » Query History.
- Filter by the warehouse your Snowpark Connect for Spark session uses.
- If you set
spark.app.name, filter by Query Tag containingSpark-Connect-App-Name=<your app name>.
This lets you inspect the exact SQL that Snowpark Connect for Spark generated, review execution times, and identify slow queries. You can also use the QUERY_HISTORY view for programmatic analysis.