Observability in Snowflake apps
Through observability built into Snowflake, you can ensure that your applications are running as efficiently as possible. Using the practices and features described in this topic, you can make the most of observability features that show you where you can improve your code.
What is observability?
In an observable system, you can understand what’s happening internally through external evidence generated by the system—evidence that includes telemetry data, alerts, and notifications.
Through the evidence of internal functioning it provides, observability makes it easier for you to troubleshoot hard-to-understand behaviors on a production system. This is especially true in a distributed system, where evidence collected from observation provides a view of behavior across multiple components. Rather than disrupting a production environment to diagnose issues, you can analyze the collected data from it.
With an observable system, you can start to answer questions such as the following:
How well is the system performing?
Where is there latency and what’s causing it?
Why is a particular component or process not working as it should?
What improvements can be made?
Observability in Snowflake
Snowflake supports a model that provides built-in observable data while also giving you ways to add more instrumentation where you need it. While Snowflake provides support for telemetry data such as logs, metrics, and traces (which are typical of observability), it also includes other features you can use to keep track of system usage and performance.
The following lists features you can use to receive and analyze system performance and usage.
As your application generates logs, metrics, and traces, Snowflake collects that telemetry data in an event table. Using Snowsight, you can explore the data, looking for patterns. You can emit custom telemetry into the event table to provide contextual, domain-specific information to expedite debugging. |
|
History Tables |
Use the following views and their associated tables to monitor all usage in your account. |
Alerts allow for customizable triggering conditions, actions, and a schedule, in combination with notification integrations for proactive monitoring. |
|
The Snowflake event table adopts OpenTelemetry standards, so your Snowflake telemetry can easily be consumed by other ecosystem tools. |
Telemetry data collected for analysis
As code in your application executes, you can have Snowflake collect data from the code that tells you about the application’s internal state. Using this telemetry data—collected in a Snowflake event table (your account has one by default)—you can look for bottlenecks and other opportunities to optimize.
Telemetry data must be emitted as your code executes. Snowflake emits some of this data on your code’s behalf without you needing to instrument your code. You can use also APIs included with Snowflake to emit telemetry data from specific parts of your code.
As described below, you can analyze the collected data by querying the event table or using the visualizations that capture the data in Snowsight.
Types of telemetry data
To ensure that the telemetry data you collect is broadly useful, Snowflake telemetry is built on the standard OpenTelemetry (sometimes called OTel) framework, an incubating project of the Cloud Native Compute Foundation. Through this framework (and APIs and tools designed for it), you can reuse collected data with tools besides Snowflake. Through OpenTelemetry, you can instrument application code to add observability where you want it.
Snowflake event tables collect log, span, and metrics data in the OpenTelemetry data model. The following describes each type of telemetry data collected in an event table.
Logs record individual operations performed by code. Each log message is generated at a discrete point during the execution of the code. Instrumenting code You can log from your code using libraries standard for the language you’re using, as listed in Logging from handler code. Viewing data You can view log messages for analysis either by querying the event table or looking at the visualizations provided in Snowsight. The following image from Snowsight shows a list of collected log messages for a two-hour period in a single database. 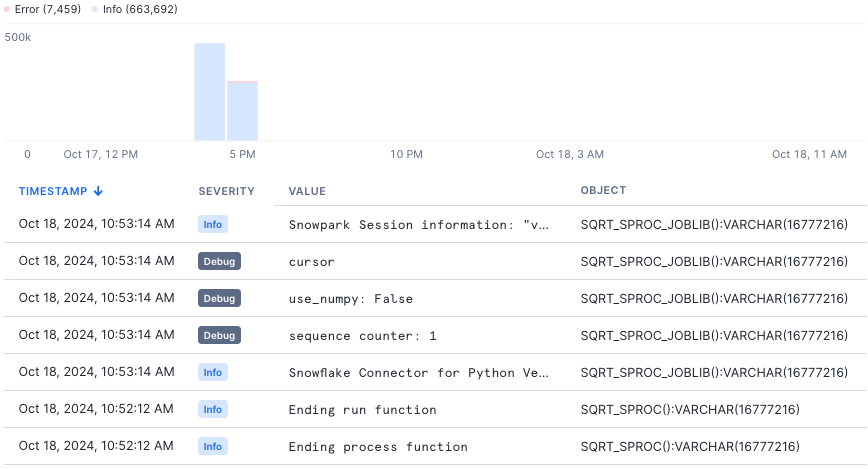
|
|
Metrics are measurements calculated over a time period. These values include CPU and memory measurements. Instrumenting code Snowflake emits metrics data automatically as your code executes, so you don’t need to instrument your code. Viewing data You can view metrics data for analysis either by querying the event table or looking at the visualizations provided in Snowsight. The following image from Snowsight shows changes in collected metrics data for the execution of a user-defined function. 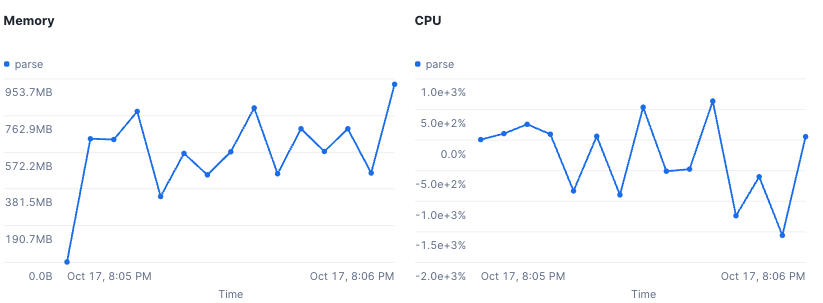
|
|
Traces show distributed events as data flows through a system. In a trace, you can see where time is spent as processing flows from component to component. You can emit trace events—both within the default span Snowflake creates or from a custom span you create—using libraries standard for the language you’re using, as listed in Logging from handler code. Instrumenting code You can emit trace events from your code using libraries standard for the language you’re using, as listed in Event tracing from handler code. Viewing data You can view trace events for analysis either by querying the event table or looking at the visualizations provided in Snowsight. The following image from Snowsight shows the spans resulting as a UDF executes. 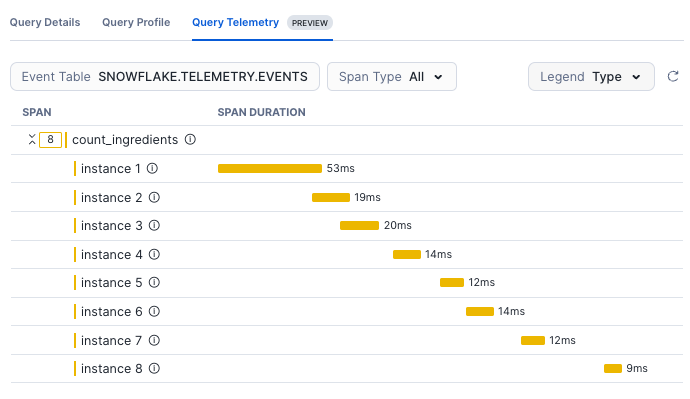
|
Telemetry best practices
Use the following best practices to get the most out of observablity in Snowflake.
Set up your environment to capture telemetry data before you need it
You can’t analyze data that you haven’t collected, so it’s best to start collecting telemetry data so you’ll have it when you need it. As your deployment grows, your need to understand how your code is performing grows.
Use the following best practices:
Enable telemetry data collection for your Snowflake environment.
To collect the data you’ll need, ensure that you have an active event table.
To ensure you’re collecting telemetry data you want, set telemetry levels to useful thresholds.
At first, you’ll want to set these levels to ensure that you’re collecting data. For example, set log levels to at least WARN for any production or business critical jobs. Over time, you might adjust these levels to meet changing needs.
Organize your production stored procedures, UDFs, and other objects under a database or schema so you can simply enable warning logs for that database or schema. This saves the trouble of managing settings for separate objects.
To generate data for troubleshooting, add log statements or trace events to your production jobs.
When you use standard logging libraries such as Java’s SLF4J or Python’s logging libraries, Snowflake routes logs from those packages to your event table automatically.
For tracing, you can use telemetry libraries included with Snowflake.
To include in trace data parts of the handler’s processing that you want to measure, add custom spans to your stored procedure handler code.
Along with the built-in spans from Snowflake objects, Snowflake represents custom spans you create in the trace diagram. With custom spans, you can capture data about arbitrary parts of your code’s processing to see how long those parts take to execute. You can also attach arbitrary metadata to custom spans to add descriptions to the data for troubleshooting and optimizing.
Optimize procedures with query telemetry
In the Query Telemetry trace diagram, you’ll find data about all the spans emitted from a query.
The horizontal axis displays duration. A span that appears longer horizontally took longer to complete than a shorter span.
The vertical axis displays the call hierarchy. In that hierarchy, any span that is directly under another span is a “child” of the “parent” span above it.
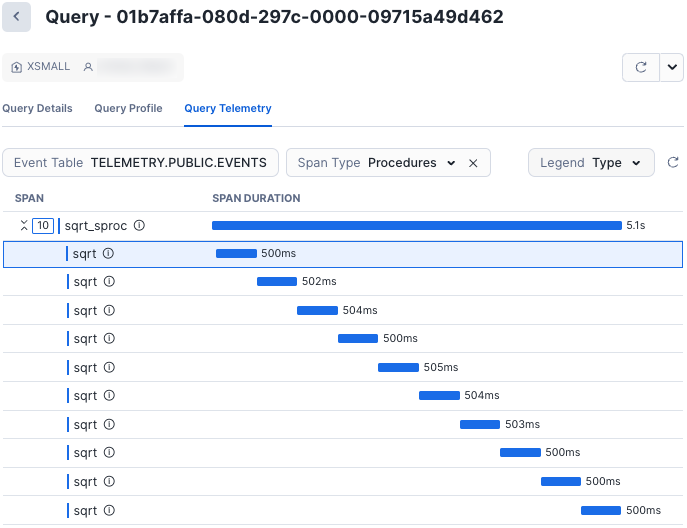
You can use this diagram to find opportunities for optimization in stored procedures. Using what you see in the diagram as a starting place, you can take steps to optimize your code.
For example, you might organize sequential operations so they execute in parallel using libraries like joblib. Joblib is a set of tools for adding pipelining to Python code. With it, you can more easily write parallel code.
Cache redundant DataFrame operations
When you have a chain of DataFrame operations that is used multiple times, you’ll see them in the trace diagram as a span for each DataFrame action. Depending on the query’s complexity, this span can be quite long.
For example, in the code below the same DataFrame chain is called in multiple contexts:
count = session.table(...).select().filter().join().count()

if count > 0:
  session.table(...).select().filter().join().write.save_as_table(...) # same query as the count, this will execute again
else:
  session.table(...).select().filter('other criteria').join() # nearly same query as the count
Using caching improves performance by caching the intermediate DataFrame as a temporary table, reducing redundant queries:
cached_df = session.table(...).select().filter().join().cache_result()
count = cached_df.count()

if count > 0:
  cached_df.write.save_as_table() # reuses the cached DF
else:
  cached_df
Manage the amount of telemetry data received for UDFs
When adding code to collect telemetry data with UDFs, remember that the UDF execution model can mean many more rows in the event table than for a procedure.
When a UDF is called on every input row, your handler code emits logging statements or span events for every row of the input dataset. For example, a dataset of 10 million rows passed to a UDF would emit 10 million log entries.
Consider using the following patterns when adding logs and span events to UDFs:
Initially, use logging levels designed to reduce the number of entries recorded.
Use DEBUG- or INFO-level logging statements and set the logging level to WARN in production. If an issue is found, you can lower the logging level to DEBUG or INFO for the duration of the debugging session.
Use try/catch blocks to isolate the code from which you want to emit logging data.
Using try/catch can be useful to catch any unexpected UDF input, log it as a WARN-level log for awareness, and return a default value.
Use condition statements to log only for scenarios that are meaningful to you.
With if/else statements or other constraints, you can control the volume of logging output.
Optimize user-defined functions with query telemetry
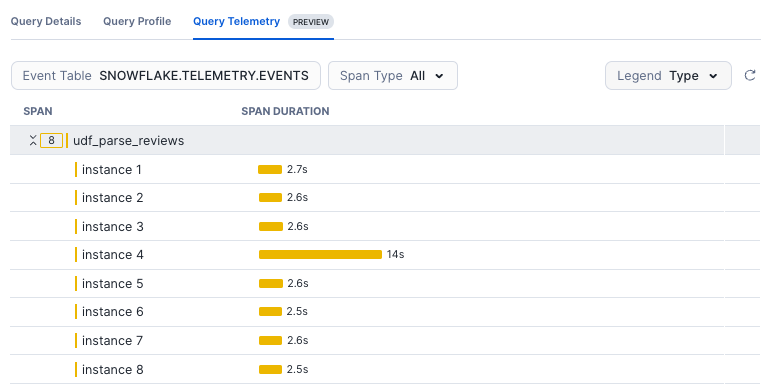
When a UDF is called, Snowflake executes it in parallel by creating an instance of the handler code for each input row. You’ll see each of these instances represented as its own span in a trace diagram.
You can use these spans to troubleshoot slow queries and find opportunities to improve performance. For example, you might see scenarios such as the following:
One or more instances of your UDF code might receive a row with data that is significantly larger or otherwise unlike the rest of your data. When this happens, that instance might take much longer to complete, and therefore its span is much longer.
Depending on your query’s input partitioning and preceding clauses, a minority of the instances might receive an outsized amount of input data.
The following image shows a span for each row passed to a UDF, where one span’s longer duration suggests that the row might have larger data than the others.
Alerts and notifications for time-sensitive response
You can use Snowflake alerts and notifications to have your system reveal what’s going on inside, then take action or send information about system state. Unlike telemetry data, which you collect and analyze later, alerts and notifications are useful when you want an immediate response to what’s happening in the system.
With an alert, you can specify a condition, action, and schedule, then specify that the action should take place when the condition and schedule details are met.
For example, you might use an alert to monitor complex conditions that you specify in SQL. The most common action after an alert condition is met is to send a notification. Snowflake supports sending notifications to email, cloud service provider queues, Slack, PagerDuty, and Microsoft Teams.
With a notification, you can use included stored procedures to send messages to destinations such as email addresses, webhooks (for client tool integrations such as a chat tool), or to a queue hosted by a cloud service.
Alerts and notifications best practices
Use the following practices to improve observability by refining and increasing the amount of information you receive from the system.
Avoid duplicating event evaluation.
You can avoid duplicating evaluation on events by accounting for the latency between the alert schedule and execution. To do this, specify alert timestamps using SCHEDULED_TIME and LAST_SUCCESSFUL_SCHEDULED_TIME instead of using CURRENT_TIMESTAMP.
For more information, see Specifying timestamps based on alert schedules.
Enrich an alert action or notification with query results.
You can check the results from the SQL statement specified by an alert condition. To obtain the query results, do the following:
Retrieve the query ID for the alert condition’s SQL statement by calling GET_CONDITION_QUERY_UUID.
Pass the query ID to RESULT_SCAN to obtain the query results.
Log a result or take automated action in addition to sending a notification.
You can specify that an alert action runs a task or logs a new row to a table whenever an alert condition is met. For example, you might do this if you’ll take an action in Snowflake each time the alert condition is met.
If you intend to perform a complex action after a condition is met, ensure that your warehouse is an appropriate size.
Tools for analysis and visualization
You can use the telemetry data collected in your event table with other tools that support the OpenTelemetry data model.
Through Snowflake support of OpenTelemetry, you can use APIs, SDKs, and other tools to instrument, generate, collect, and export telemetry data. Using these tools, you can more thoroughly analyze software performance and behavior. Because a Snowflake event table uses this widely-adopted standard, you might also be able to integrate your organization’s observability tools with event tables with little overhead.
Consider integrating your external tools in one of the following ways:
If your observability tools can read from external sources, point them to the event table.
If your tools use a push model—in which telemetry data must be sent to the tool—consider using a stored procedure with external access to regularly read telemetry data from the event table and emit it to your tool.
The following lists tools you might integrate with Snowflake event tables:
Snowflake integration for Grafana dashboard
For an introduction to using Grafana with Snowflake, see How to monitor Snowflake with Grafana Cloud.
Observe for Snowflake, Observe’s native app for observability