Monitoring Snowpark Connect for Spark workloads
Snowpark Connect for Spark uses Python’s standard logging module for diagnostics. When running workloads through
snowpark-submit, logs are
written to your account’s
event table, giving you full
SQL-queryable access to server and client output.
Log levels
Snowpark Connect for Spark emits logs at two primary levels:
INFOSummarizes high-level operations: session creation, query execution, UDF registration, and configuration changes. This is the default and is sufficient for most monitoring.
DEBUGAdds detailed internal state: generated SQL, plan translation steps, gRPC message details, and cache decisions. Use this level when you need to inspect the exact queries sent to Snowflake or diagnose unexpected behavior.
Configuring log output for local and notebook environments
When running the Snowpark Connect for Spark server locally (through init_spark_session), configure the logger
before importing and starting the session:
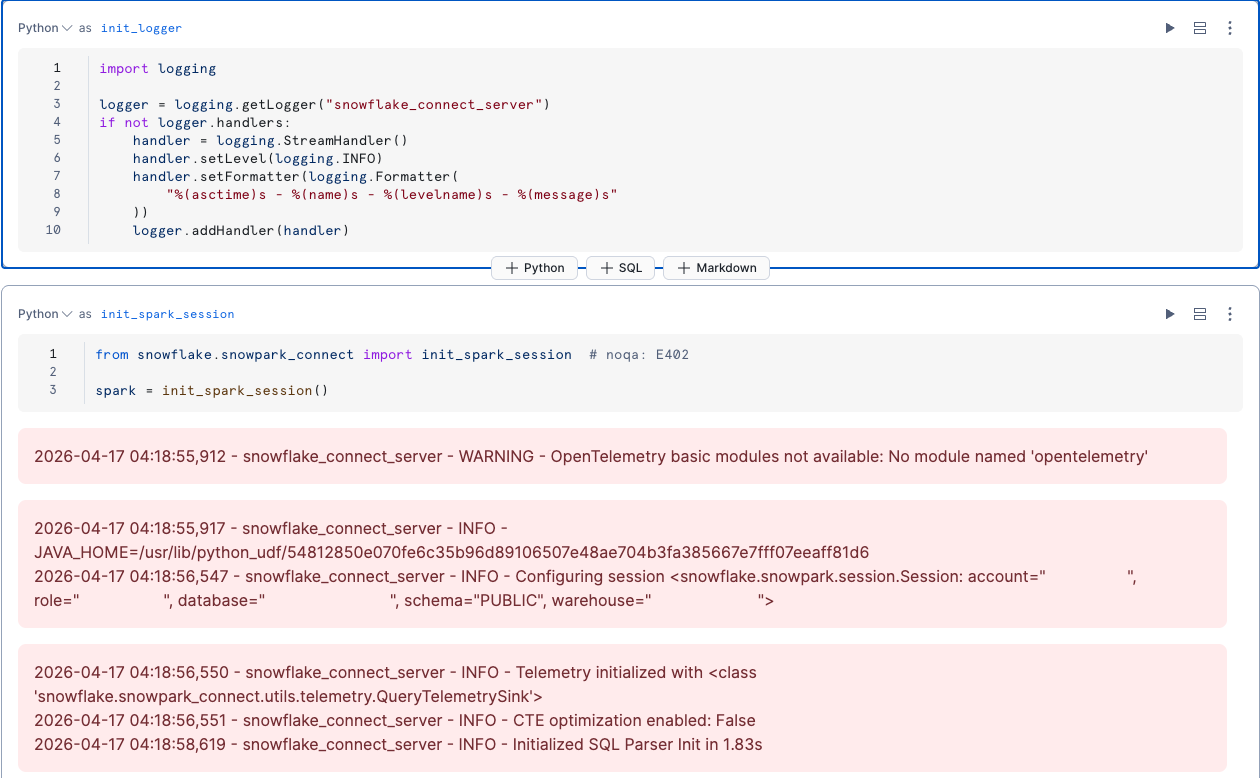
Snowflake Notebooks don’t display Python log output by default. To see Snowpark Connect for Spark logs in the
notebook cell output, attach a StreamHandler to the logger:
Event table logs for Snowpark Submit
When you run workloads through snowpark-submit, the SCOS server and client containers write logs, OpenTelemetry spans, and resource metrics to your account’s event table. This is the primary way to monitor production workloads.
Prerequisites
-
An event table configured in your account. Verify with:
For setup instructions, see Event table overview.
Note
Database-level event tables are not supported. Logs from Snowpark Submit workloads are written only to the account-level event table.
Retrieving logs via the CLI
Use the --workload-status and --display-logs flags to retrieve logs from a completed or
running job. The full workload name (with a UTC timestamp suffix) is printed when you submit:
Querying logs with SQL
For full control over filtering and analysis, query the event table directly.
Get all log lines for a job:
Tip
Always include a timestamp range. The event table can have millions of rows per day; without a time bound, queries are very slow or time out.
Filter by container:
Each job has two containers: server (SCOS internals, SQL execution) and client (your
PySpark app output).
Filter by severity:
Available severity values: DEBUG, INFO, WARN, and None (unstructured output that
doesn’t go through Python’s logging module).
Query Spark application history with SQL
The Spark Monitoring UI reads from the
GET_SPARK_APPLICATION_HISTORY table function. You can call
this function directly to build your own reports, find failed runs, or trace an application back to its queries and
event table records. Each row describes one application, and the MODE column identifies whether it’s a client
session (SCOS_CLIENT), a snowpark-submit job (SCOS_SUBMIT), an EXECUTE CODE BUNDLE job (SCOS_CODE_BUNDLE), or
a scheduled notebook run (SCOS_NOTEBOOK). By default, the function returns applications created in the last 14 days.
For the full syntax and list of output columns, see
GET_SPARK_APPLICATION_HISTORY.
Examples
List applications that failed in the last seven days, with their error details:
Count runs and average duration by mode and status over the last 14 days:
Find the queries issued by an application
To list the Snowflake queries issued by an application, pass its ID to
SNOWFLAKE.SNOWPARK_CONNECT.GET_SPARK_APPLICATION_QUERY_HISTORY. This works for client sessions (SCOS_CLIENT) as well
as batch jobs, and is the main way to trace a client session’s work back to Snowflake queries:
The results include the queries generated by your DataFrame operations, along with setup queries that Snowpark Connect for Spark runs
when the session starts (for example, ALTER SESSION statements).
You can also use the SESSION_ID column to join a client session to query history. For example, to find the session’s
queries in QUERY_HISTORY_BY_SESSION:
Filter event table records for a batch job
Batch jobs (SCOS_SUBMIT, SCOS_CODE_BUNDLE, and SCOS_NOTEBOOK) write their logs, metrics, and traces to an event table, which is
named in the EVENT_TABLE_NAME column. Client sessions (SCOS_CLIENT) don’t write application logs or metrics to an
event table, because that code runs on the client. To trace a client session, use
its query history instead.
To retrieve the event table records for one batch job:
-
Look up the event table and the time window for the application:
-
Query that event table, filtering on the application’s
EXECUTE_QUERY_ID. Records are tagged with this value in thesnow.query.idresource attribute. ForEXECUTE CODE BUNDLEruns,EXECUTE_QUERY_IDis the same asID; forsnowpark-submitruns, it’s different, so always useEXECUTE_QUERY_ID. Spans for the individual queries that the job issued carry those queries’ own IDs insnow.query.id, so they aren’t included in this filter.Filtering on
timestampwith the application’sCREATED_ONandCOMPLETED_ONvalues limits how much of the event table Snowflake has to scan. The event tabletimestampcolumn is in UTC, so convert the window to UTC. A running job has a NULLCOMPLETED_ON, so use the current time as the end of the window until the job finishes:To return only log messages, add
AND e.record_type = 'LOG'. To return only trace spans, usee.record_type = 'SPAN'.
You need privileges to query the event table. For more information, see Event table overview.
Send an email notification when a batch job fails
You can combine GET_SPARK_APPLICATION_HISTORY with an alert and email notifications to get an email whenever a batch job fails.
-
Create an email notification integration. Recipients must be users in your account who have verified their email addresses. Creating a notification integration requires the CREATE INTEGRATION or CREATE NOTIFICATION INTEGRATION privilege:
-
Grant the privileges that the alert’s owner role needs. The alert runs as a system user, so the owner role needs the MONITOR EXECUTION privilege to see applications run by other users. Without it, the function returns no rows inside the alert and the alert never fires:
-
Create the alert. Every five minutes, the alert checks for batch jobs that failed since the last time the alert ran, and sends one email that lists them:
The action uses GET_CONDITION_QUERY_UUID to read the failed jobs that the condition returned, so the email lists each job’s name, mode, owner, and error message. Filtering on
COMPLETED_ONbetween LAST_SUCCESSFUL_SCHEDULED_TIME and SCHEDULED_TIME reports each failure once. On the alert’s first run, it reports failures from the last day. -
Resume the alert. New alerts are suspended:
To check that the alert ran and sent the email, query ALERT_HISTORY and NOTIFICATION_HISTORY. For other ways to send notifications, such as to a webhook, see Sending notifications to external systems.
Viewing generated queries in Snowsight
Every SQL statement that Snowpark Connect for Spark sends to Snowflake is visible in the Snowsight query history. To find queries from your workload:
- Sign in to Snowsight and go to Monitoring » Query History.
- Filter by the warehouse your Snowpark Connect for Spark session uses.
- If you set
spark.app.name, filter by Query Tag containingSpark-Connect-App-Name=<your app name>.
This lets you inspect the exact SQL that Snowpark Connect for Spark generated, review execution times, and identify slow queries. You can also use the QUERY_HISTORY view for programmatic analysis.