dbt integration in Cortex Code Desktop
Cortex Code Desktop includes a built-in dbt panel that provides a full development environment
for dbt projects. When you open a workspace containing a dbt_project.yml, the dbt
panel activates automatically and gives you interactive lineage visualization, compiled SQL
preview, data preview, documentation, and a command bar — all without leaving the editor.
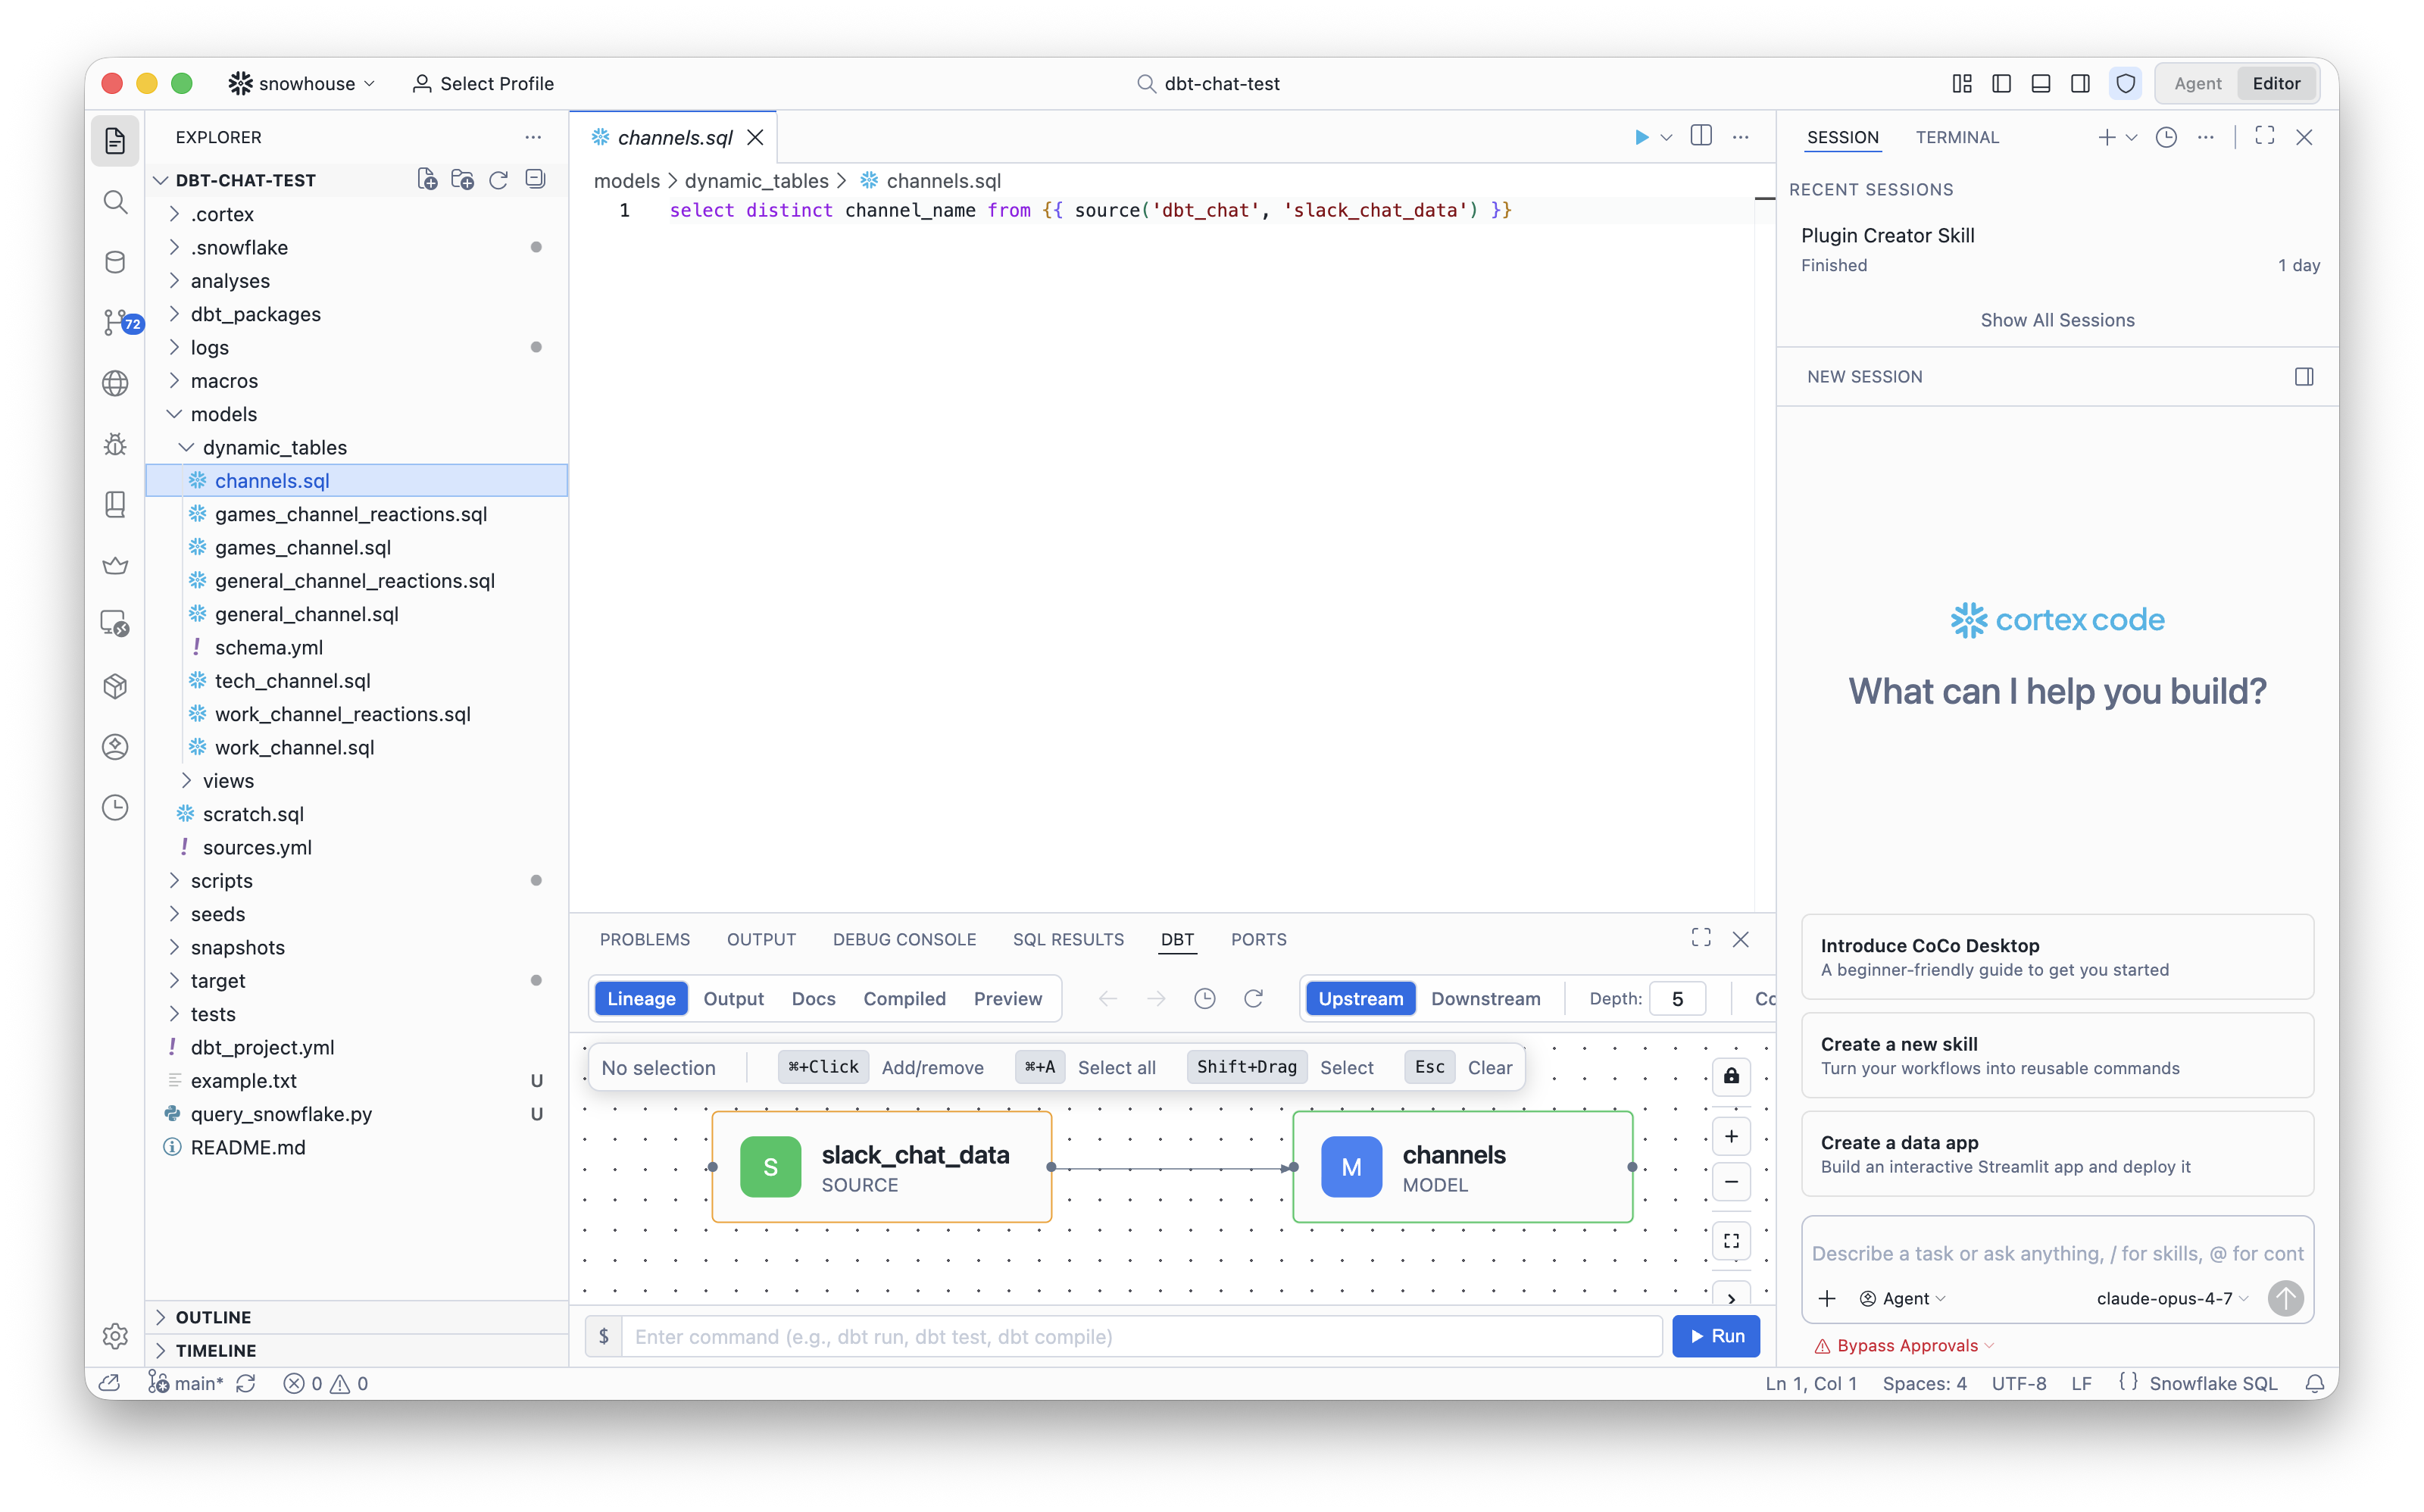
The dbt panel with the Lineage tab active, showing upstream/downstream model relationships and the command bar.
Getting started
The dbt panel appears in the bottom panel area (next to Problems, Output, Terminal, etc.) when
Cortex Code detects a dbt_project.yml in your workspace. Click the DBT
tab to open it.
The panel has five tabs and a command bar:
| Tab | What it shows |
|---|---|
| Lineage | Interactive DAG graph of model dependencies |
| Output | Real-time output from dbt commands |
| Docs | Documentation for the selected model |
| Compiled | Fully resolved SQL with all Jinja rendered |
| Preview | Data grid showing sample rows from the model |
Lineage
The Lineage tab renders an interactive directed acyclic graph (DAG) of your dbt project. It shows how models, sources, and other resources relate to each other.
- Upstream / Downstream — Toggle between viewing ancestors (upstream) or dependents (downstream) of the selected node.
- Depth — Control how many levels of dependencies to display (default: 5).
- Navigation — Use the back/forward arrows to navigate through previously viewed nodes.
- Refresh — Re-parse the project and update the graph.
- Selection — Click nodes to select them. Use ⌘+Click to add/remove from selection, or Shift+Drag to select multiple.
Tip
Select one or more nodes in the lineage graph, then use the “Add to Chat” action to attach the selected models as context to your AI conversation. This helps the agent understand your project structure when answering questions or generating code.
Output
The Output tab displays real-time results from dbt commands. Each command execution appears as a collapsible entry showing:
- The command that was run
- Timestamp and duration
- Exit code and status (running, success, or error)
- Per-model progress during
dbt runordbt build
Click Clear All to remove the output history.
Docs
The Docs tab shows the documentation for the currently selected dbt resource. It displays model descriptions, column metadata, and relationships. From the docs view you can:
- Navigate to related nodes by clicking their names.
- Open the source file for any referenced model.
- Trigger a compile to update the documentation.
Compiled
The Compiled tab shows the fully resolved SQL for the current model — all Jinja macros, refs, and sources are rendered into their final SQL form. This is the exact query that dbt would execute against your warehouse.
- Source / Compiled toggle — Switch between viewing the raw source and the compiled output.
- Syntax highlighting — Full SQL highlighting with line numbers and minimap.
- Search — Use Ctrl+F (or ⌘+F) to search within the compiled SQL.
- Copy — Copy the compiled SQL to your clipboard.
The status bar shows the model name and compilation duration.
Preview
The Preview tab executes dbt show and displays the results in an interactive data
grid. This lets you quickly inspect the output of a model without running a full build.
- Click the Preview button (or use the Show action in the control bar) to fetch data.
- The default row limit is 10; adjust it using the limit control in the grid header.
- Results are cached per model until you re-run the preview or switch models.
Command bar
At the bottom of the dbt panel is a command bar where you can type and execute any dbt command
directly. Type a command (for example, dbt run, dbt test,
dbt compile) and press Run or hit Enter.
- Use ↑ and ↓ arrow keys to navigate through command history.
- Output from commands appears in the Output tab.
Quick actions
The control bar also provides one-click buttons for common operations:
| Button | Action |
|---|---|
| Build | Runs dbt build for the current model |
| Compile | Compiles the current model and updates the Compiled tab |
| Show / Stop Show | Executes or cancels dbt show for the Preview tab |
Project detection
Cortex Code automatically detects dbt projects by scanning your workspace for
dbt_project.yml files. When a dbt file is open in the editor, the panel
automatically focuses on the corresponding model in the lineage graph and updates the
Docs, Compiled, and Preview tabs.
Note
Make sure your dbt project is properly configured with a valid profiles.yml
connection before using Preview or Build. These commands execute against your Snowflake
warehouse.