ML Observability: Monitoring model behavior over time
Model behavior can change over time due to input drift, stale training assumptions, and data pipeline issues, as well as the usual factors, including changes to the underlying hardware and software and the fluid nature of traffic. ML Observability allows you to track the quality of production models you have deployed via the Snowflake Model Registry across multiple dimensions, such as performance, drift, and volume. Additionally, you can monitor model performance across different segments of your data using string categorical columns.
Currently, the model monitor supports regression and binary classification models.
Note
To dive in and start using ML Observability, see the quickstart.
ML Observability workflow
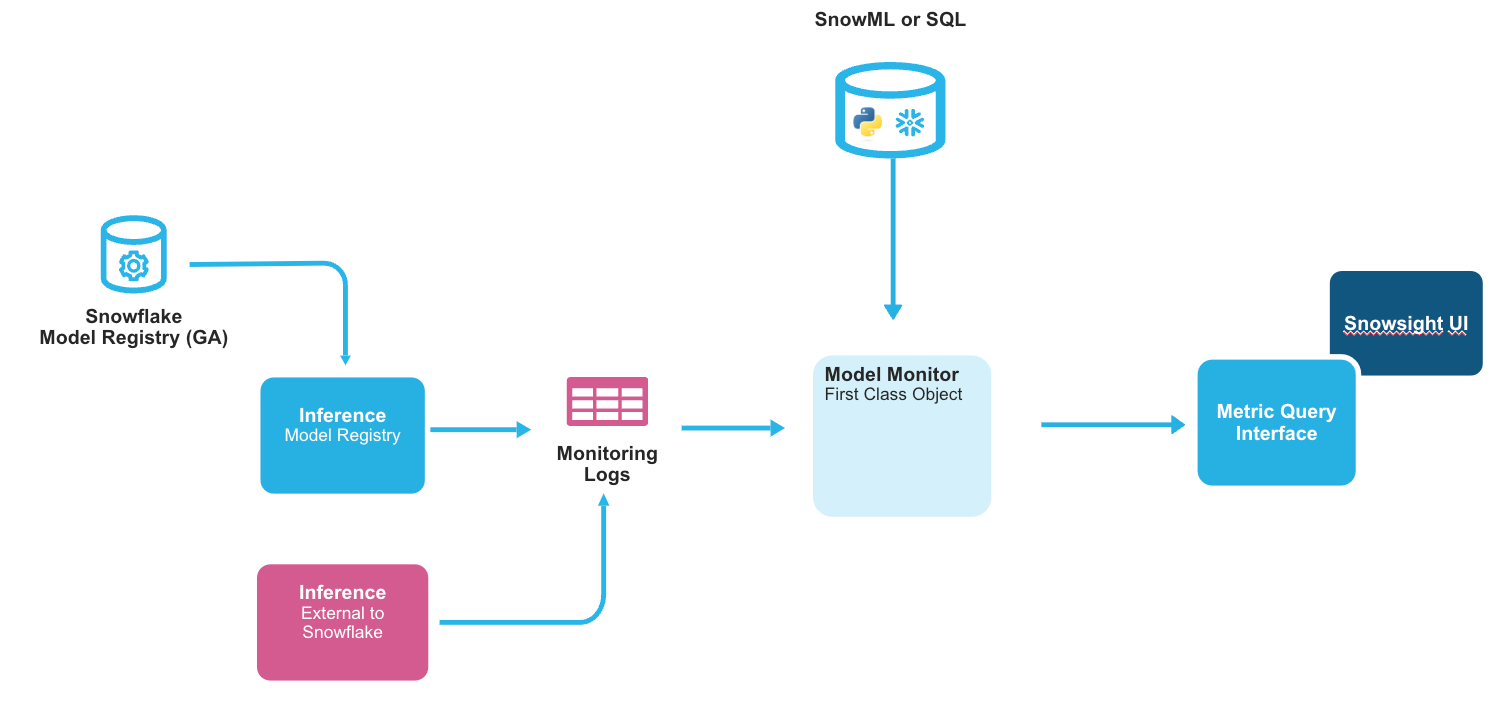
When you use a model that has been logged in the Snowflake Model Registry for inference, you receive results in the form of a Snowpark or pandas DataFrame, depending on the type of input DataFrame passed to the inference method. This data typically originates in Snowflake. Even in cases where inference is run outside Snowflake, it is common to store the results in Snowflake. ML Observability allows you to monitor your model’s performance in both of these scenarios by working on the stored inference data. The typical workflow is shown below.
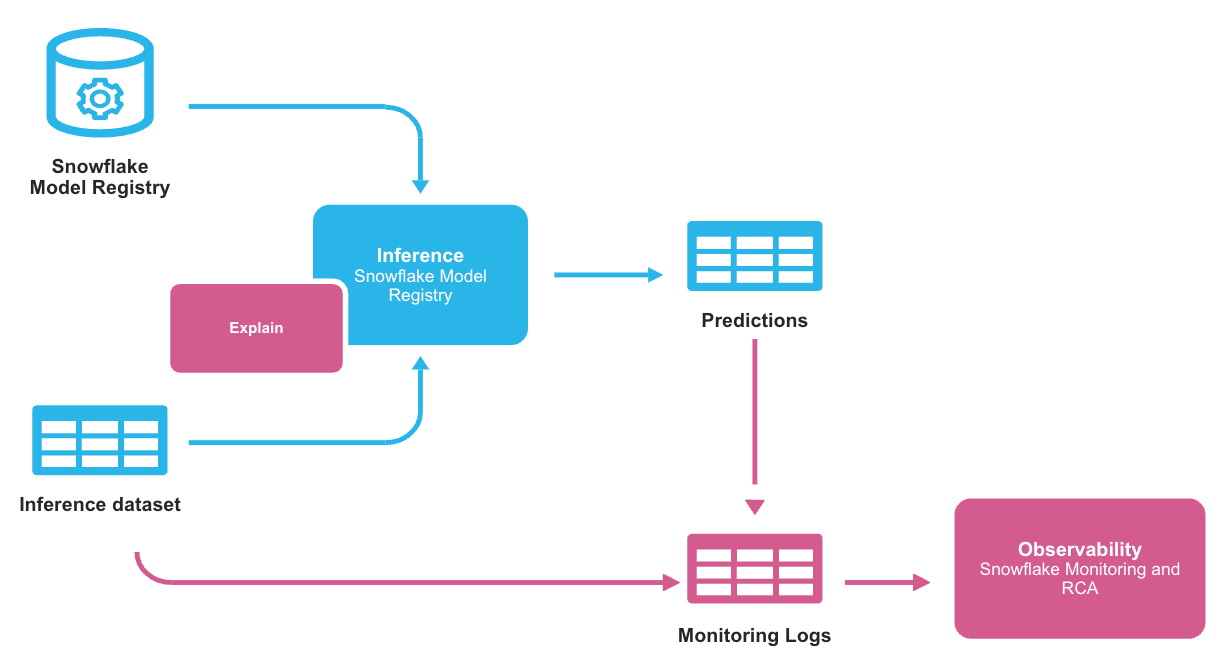
The monitoring logs store the inference data and the predictions so that the ML Observability feature can observe changes in predictions over time. The monitoring logs are stored in a table that contains an ID, a timestamp, features, predictions, and a ground truth label, which indicates whether a given row is a prediction or observed data. The basic structure is shown below.
You must explicitly create a model monitor object for each model version you want to monitor. Each model version can have exactly one monitor, and each monitor can monitor exactly one model version; they cannot be shared. The monitor object automatically refreshes the monitor logs by querying source data and updates the monitoring reports based on the logs.
Each monitor encapsulates the following information:
The model version to monitor.
The table in which the monitor logs are stored.
The minimum time granularity at which data is stored (aggregation window), currently 1 day minimum.
An optional baseline table for comparative metric operations such as drift.
Prerequisites
Before you begin, make sure you have the following:
A Snowflake account.
Version 1.7.1 or later of the
snowflake-ml-pythonPython package.Familiarity with the Snowflake Model Registry.
Creating a model monitor
Create a model monitor using the CREATE MODEL MONITOR command. The model monitor must be created in the same schema as the model version to be monitored. You must have the CREATE MODEL MONITOR privilege on the schema where the monitor is created. You can create a maximum of 250 model monitors per account.
See CREATE MODEL MONITOR for more details on the CREATE MODEL MONITOR command.
Tip
For details on other SQL commands that you can use with model monitors, see Model monitor commands.
Temporarily stopping and resuming monitoring
You can suspend (temporarily stop) a model monitor using ALTER MODEL MONITOR … SUSPEND. To resume monitoring, issue ALTER MODEL MONITOR … RESUME.
Automatic suspension on refresh failure
Model monitors automatically suspend refreshes when they encounter five consecutive refresh failures related to the source tables. You can view the status and cause of refresh suspension using the DESCRIBE MODEL MONITOR command. The output includes the following columns, among others:
aggregation_status: The value in this column is a JSON object. One or more of the values in this object will be SUSPENDED if the model monitor is suspended.aggregation_last_error: The value in this column is a JSON object that contains the specific SQL error that caused the suspension.
After resolving the root cause of the refresh failure, resume the monitor by issuing ALTER MODEL MONITOR … RESUME.
Adding Segments to a model monitor
Model monitors support segmentation, which allows you to monitor model quality over time for specific subsets of your data in addition to monitoring the complete dataset. Segments are used to group the data into logical units, such as different regions or different user groups.
Creating monitors with segments
When creating a model monitor, you can specify segment columns using the SEGMENT_COLUMNS parameter. Segment columns must be string columns in your source data.
Important
To create segments on numeric columns, bucket them into valid categories before you create the monitor. For example, you can transform a numeric TEMPERATURE column into categorical values like ‘COLD’ (< 32°F), ‘MODERATE’ (32-80°F), and ‘HOT’ (> 80°F) before using it as a segment column.
For complete syntax and parameter details, see CREATE MODEL MONITOR.
Adding segments to existing or new monitors
You can add segment columns to existing monitors using the ALTER MODEL MONITOR command:
You can also remove segment columns from existing monitors:
For complete syntax and options, see ALTER MODEL MONITOR.
Defining the segment in Monitoring Segments in the UI
You can configure and manage segments through the Monitoring Segments settings in the UI:
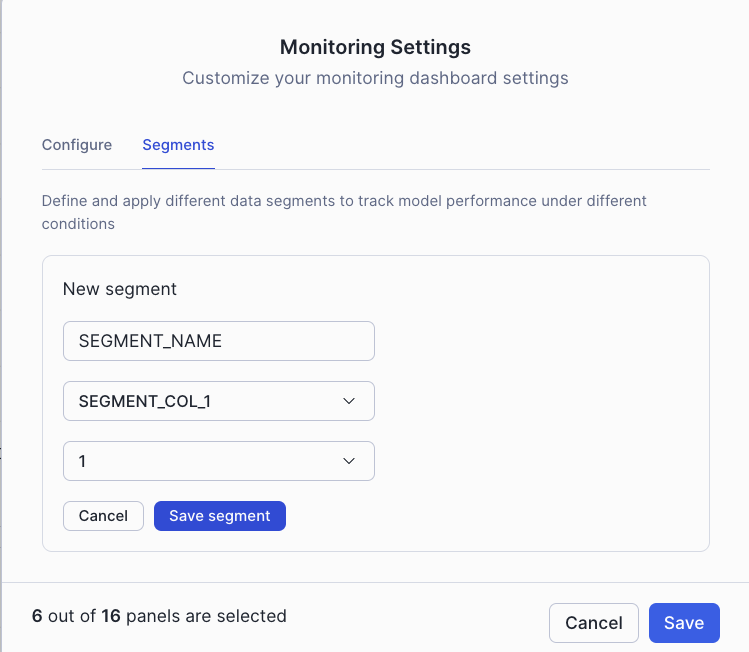
The segments settings interface allows you to define and configure which segments to monitor for your model.
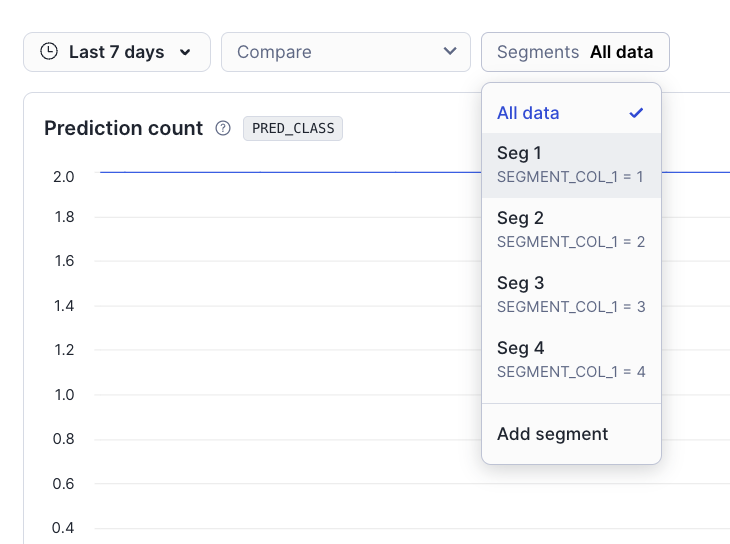
Choose the segment in the segments selector in the model monitor dashboard
In the model monitor dashboard, you can use the segments selector to view metrics for specific segments of your data:
Performance considerations for segments
Performance depends on many factors, like number of features, number of segment columns, unique values per segment column, warehouse size, warehouse type, aggregation window, total rows, and rows per aggregation window.
Performance impact of CREATE with SEGMENT_COLUMNS is directly proportional to the number of segment columns in the request
If CREATE performance is slow with many segment columns, consider adding segment columns one at a time using the ALTER command
Each segment column and value combination is independently queried, and there may be time differences in when data was last updated based on scheduling and other factors. But we try best to update all the data at the same time.
Viewing monitoring reports
To view monitor reports, visit the ML Monitoring dashboard in Snowsight. In the navigation menu, select AI & ML » Models. The resulting list contains all the models in the Snowflake Model Registry in all the databases and schemas that your current role has access to.
Open a model’s details page by selecting the corresponding row in the Models list. The details page displays key model information, including the model’s description, tags, versions, and monitors.
The Monitors list in the details page displays the list of model monitors, the model versions they are attached to, their status, and when they were created.
Open a model monitor dashboard page by selecting the corresponding row in the Monitors list. The dashboard is populated with graphs displaying key metrics of the model over time. The exact graphs displayed depend on the type of model the monitor is based on (that is, binary classification or regression).
In the dashboard, you can take the following actions:
Change the range of the graphs by clicking the time range selector.
Change the graphs shown by clicking the Settings button. (Hover the mouse over a metric name to see more information about it.)
Compare model monitors by clicking the Compare model selector drop-down.
Display more information about the model monitor by selecting Display monitor details.
Querying monitoring results
Each model monitor that you create has the following metrics:
Drift metrics: Distribution changes or data shifts
Performance metrics: Distribution changes or data shifts
Statistical metrics: Counts or null values
To query the metrics computed by the monitor, use the monitor metric functions. The metric functions get the metrics from the model monitor objects. You can use the results from the metric functions to create custom dashboards in Streamlit or other centralized monitoring tools.
Important
You must have the following privileges to work with model monitor objects:
Command |
Required privileges |
|---|---|
CREATE MODEL MONITOR |
|
SHOW MODEL MONITORS |
Any privilege on the model monitor |
DESCRIBE MODEL MONITOR |
Any privilege on the model monitor |
ALTER MODEL MONITOR |
MODIFY on the model monitor |
DROP MODEL MONITOR |
OWNERSHIP on the model monitor |
Use the following SQL template to get the drift metric from your model monitor.
Use the following SQL template to get the performance metric from your model monitor.
Use the following SQL template to get the statistical metric from your model monitor.
Querying segment-specific metrics
To query metrics for specific segments, use the <extra_args> parameter with a JSON format that specifies the segment column and value. The <extra_args> parameter is optional - if not provided, the query returns metrics for all data (non-segment query).
Note
Currently, segment queries support only 1 segment column:value pair per query. You cannot query multiple segments simultaneously in a single function call.
For segment queries, use this format for the <extra_args> parameter:
For example, to get drift metrics for premium customers only:
The result tables for segment queries include two additional columns:
SEGMENT_COLUMN: Name of the segment column for which the metric is computed (or NULL for non-segment queries)SEGMENT_VALUE: Segment value for which the metric is computed (or NULL for non-segment queries)
For more information about segments, see Adding Segments to a model monitor.
You can set up alerts and notifications for your monitoring metrics. For more information, see Alerts and Notifications.
Known limitations
The following limitations apply to model monitors:
Monitors must reside in the same database and schema as the model version.
Only single-output regression and binary classification models are supported.
At least one prediction column (class or score) is required; actual columns are optional but needed for accuracy metrics.
Drift calculation requires baseline data; without it, to add baseline data, you must drop the monitor and create it again.
Each column can only be used once in the monitor. For example, you can’t use the same column as the ID column and the prediction column.
Data can’t contain invalid values (nulls, NaNs, +/-Inf, probability scores outside 0-1, non-binary classes, or more than two classes in a PREDICTION_CLASS_COLUMNS column) to avoid monitor failure and suspension.
Timestamp columns must be of type
TIMESTAMP_NTZ; prediction and actual columns must beNUMBER.You must specify the aggregation windows in days.
A maximum of 500 features can be monitored.
Up to 250 monitors can be created.
Segment columns must be string categorical columns only.
A maximum of 5 segment columns per model monitor (hard limit).
Each segment column should have fewer than 25 unique values (recommended limit).
Segment values are case sensitive and special characters are not supported for segment queries.
NULL filtering is not supported for segment queries.
Cost considerations
Virtual warehouse compute:
Model monitors use a virtual warehouse, incurring costs during creation and each refresh.
Loading the Snowsight dashboard also uses a virtual warehouse, incurring additional charges.
Storage:
Model monitors materialize the source data into a table stored in your account.
Segment columns add additional materialized table stored in your account.
Cloud services compute:
Model monitors use cloud services compute to trigger refreshes when an underlying base object has changed. Cloud services compute cost is only billed if the daily cloud services cost is greater than 10% of the daily warehouse cost for the account.