Monitor dynamic tables
This topic describes how to view and monitor the dynamic tables in your pipelines. For guidance on what to look for when diagnosing performance issues, see Monitor dynamic table performance.
Section |
Description |
|---|---|
List the dynamic tables in a schema and view information about them. |
|
See the graph of tables connected to your dynamic tables. |
|
Monitor your dynamic tables using SQL table functions. |
|
View the refresh status for your dynamic tables. |
List dynamic tables or view information on specific columns
To list the dynamic tables in a schema and view information about those dynamic tables, you can use either the following SQL commands or Snowsight, as long as you use a role that has the MONITOR privilege on the dynamic tables.
For more information, see Privileges to view a dynamic table’s metadata.
To list the dynamic tables in the current database (or in the account, if no database is currently in use), use the SHOW DYNAMIC TABLES command.
For example, to list the dynamic tables with names that start with product_ in the database mydb and schema myschema, execute
the following SQL statement:
To output information about the columns in a dynamic table, use the DESCRIBE DYNAMIC TABLE command.
For example, to list the columns in my_dynamic_table, execute the following SQL statement:
Dynamic tables are also included in the results of the TABLES view.
To list the dynamic tables in a schema and view information about a specific dynamic table, do the following:
Sign in to Snowsight.
In the navigation menu, select Catalog » Database Explorer.
Select a database and schema.
Select the Dynamic Tables tab or expand Dynamic Tables in the database object explorer.
To view information about a specific dynamic table, select the dynamic table from the list of dynamic tables in the Dynamic Tables tab or from the database object explorer.
The tabs in this page provide the following details about your selected dynamic table:
Table Details: Displays basic information about the dynamic table, including:
The scheduling state of your dynamic table.
The last refresh status of your dynamic table. For failed refreshes, you can see more information about the error if you hover over the status.
The current and target lag for your dynamic table.
Whether incremental refreshes or full refreshes are used to update the table.
The definition of the dynamic table.
The tags for the dynamic table.
The privileges granted for working with the dynamic table.
Columns: Information about the columns in the dynamic table.
Data Preview: A preview of up to 100 rows of the data in the dynamic table.
Graph: Displays the directed acyclic graph (DAG) that includes this dynamic table.
Refresh History: Displays the history of refreshes and the lag metrics.
View the graph of tables connected to your dynamic tables
Viewing dependencies is particularly useful for troubleshooting dynamic table chains. In Snowsight, you can visualize which dynamic tables a given dynamic table depends on using the lineage graph. For example, you can identify the following:
Upstream dependencies where a dynamic table pulls data from.
Downstream dependencies that might be impacted by changes to a dynamic table.
Dependencies can impact refresh performance. For example, suppose your dynamic table’s upstream table has a large data load added just before its scheduled refresh. Your dynamic table will wait for it to finish the refresh, causing it to miss its target lag. In the lineage graph, you’d see the input table marked as “executing,” indicating the delay.
To view the graph of a particular dynamic table, do the following:
Sign in to Snowsight.
In the navigation menu, select Transformation » Dynamic tables.
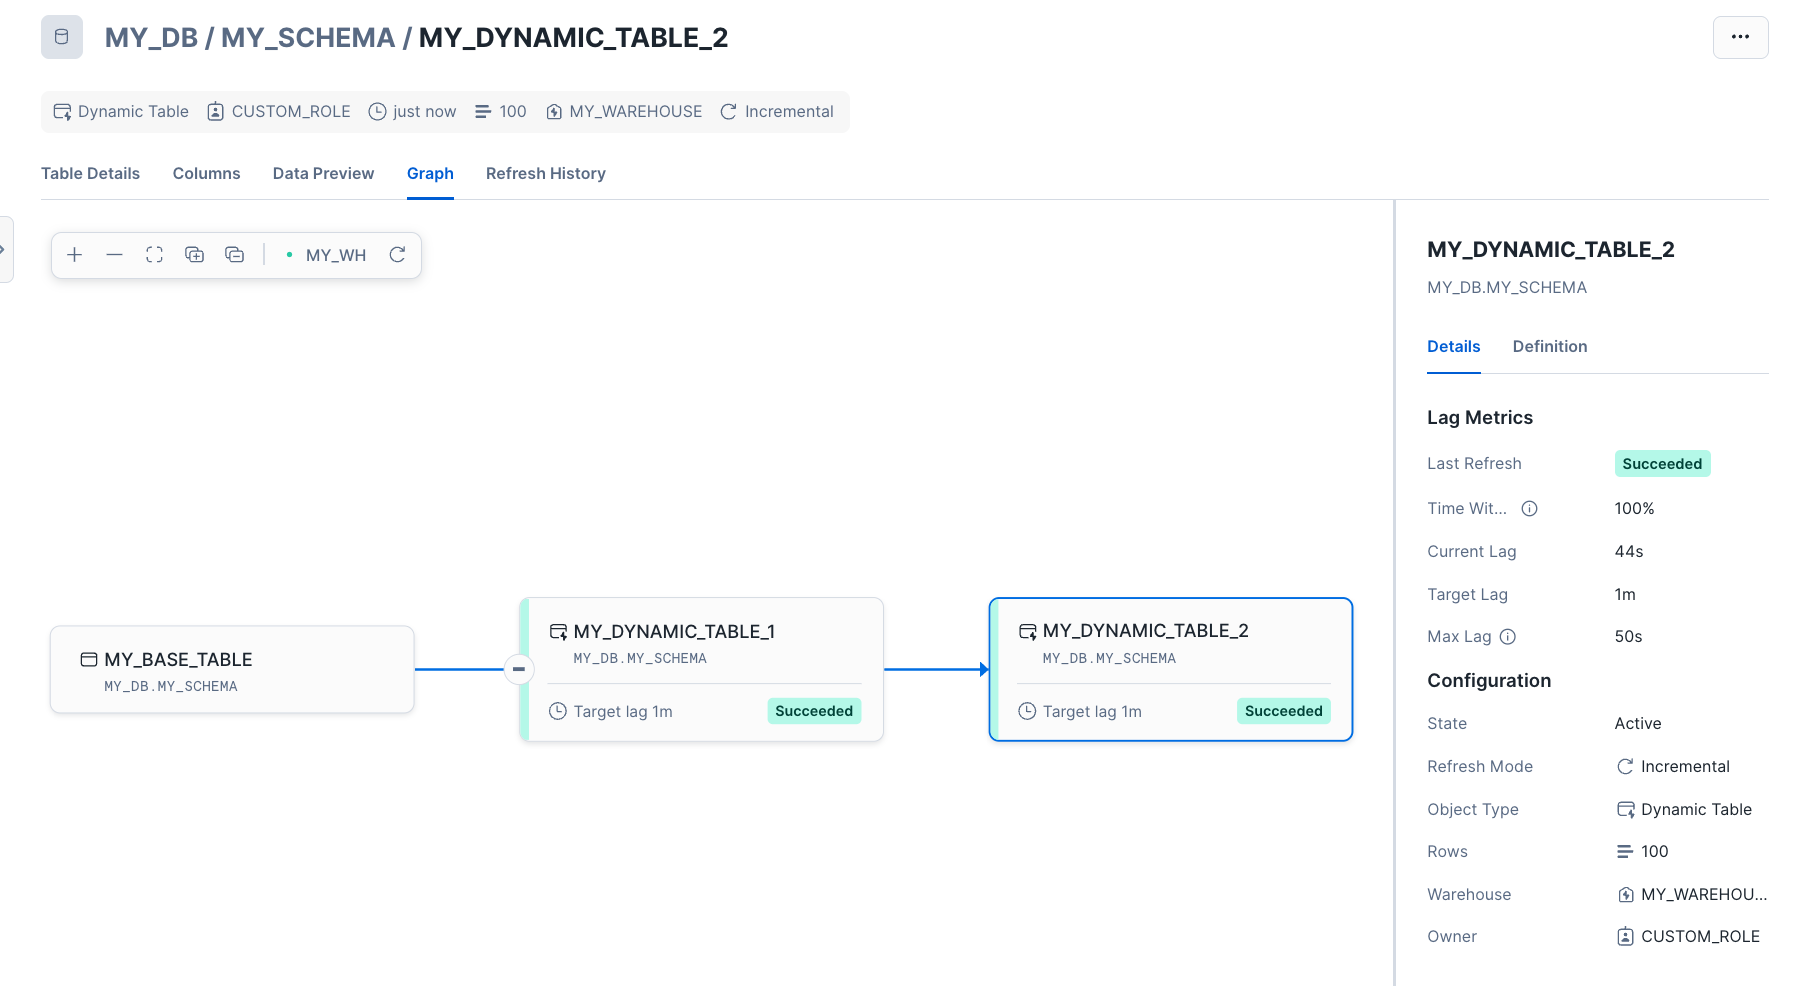
Select your dynamic table. The Graph view is displayed by default. This displays the graph with the node for the dynamic table selected. The Details pane on the right displays information about its lag metrics and configuration.
To display the details of a different table in the graph, select that table.
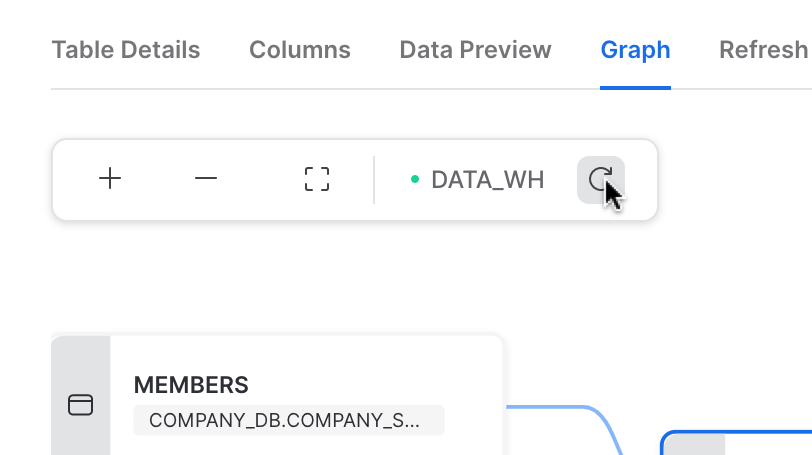
To update the graph, select the refresh button in the bar above the graph.
If a refresh failed due to an UPSTREAM_FAILED error code, you can use the graph to visualize which upstream table caused the failure.
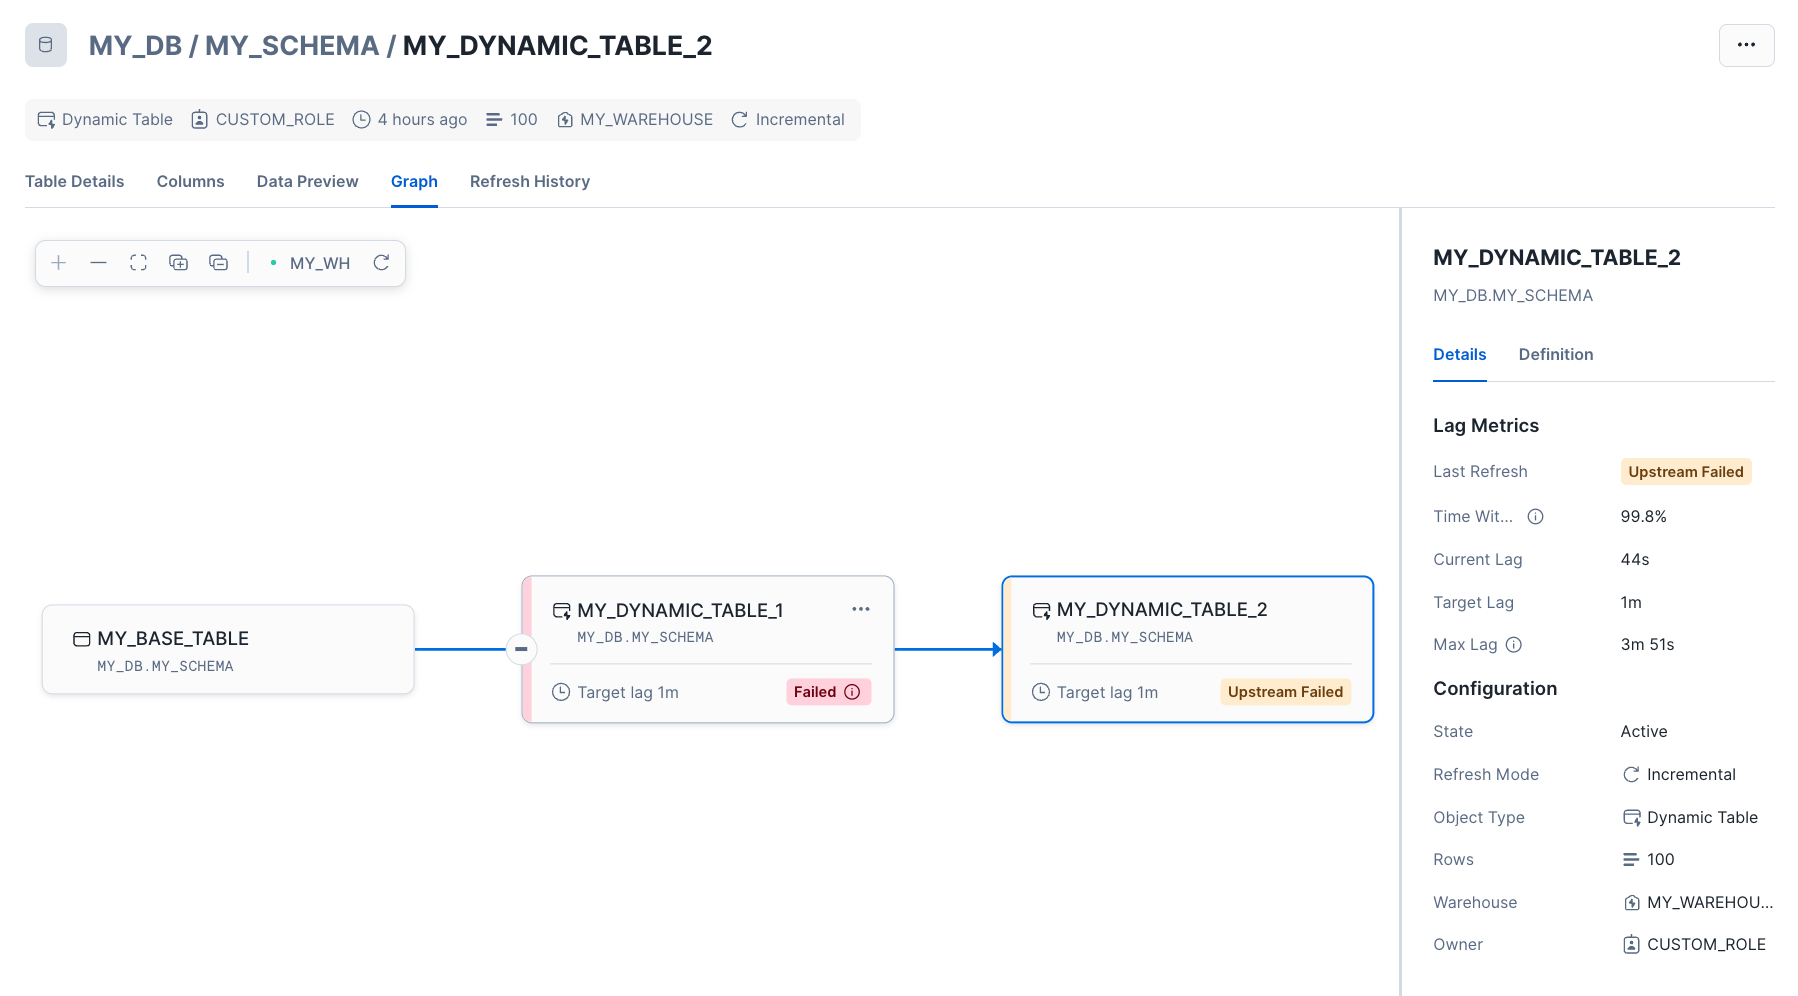
To view the full details of a table in the graph, see List dynamic tables or view information on specific columns.
Monitor your dynamic tables using SQL table functions
Use the following INFORMATION_SCHEMA table functions to monitor your dynamic tables:
DYNAMIC_TABLES: Returns metadata about your dynamic tables, including aggregate lag metrics and the status of the most recent refreshes, within seven days of the current time.
DYNAMIC_TABLE_REFRESH_HISTORY: Returns information about each completed and running refresh of your dynamic tables, including refresh status and trigger, and the target lag.
DYNAMIC_TABLE_REFRESH_HISTORY view: This Account Usage view also displays information for dynamic table refresh history. It is useful for debugging issues that are for longer than the DYNAMIC_TABLE_REFRESH_HISTORY table function’s data retention time (seven days).
DYNAMIC_TABLE_GRAPH_HISTORY: Returns information that provides the history of each dynamic table, its properties, and its dependencies on other tables and dynamic tables.
You can use this table function to get a snapshot of the dependency tree of dynamic tables at a given point in time.
The output also reflects the changes made to the properties of a dynamic table over time. Each row represents a dynamic table and a specific set of properties. If you change a property of a dynamic table (for example, the target lag), the function returns the most up to date property.
Monitor the refresh status for your dynamic tables
This section explains how to view the refresh status of all or specific dynamic tables.
For guidance on what to look for when diagnosing slow refreshes, see Monitor dynamic table performance.
For troubleshooting skipped or failed refreshes, see Troubleshooting skipped or failed dynamic table refreshes.
Monitor the refreshes for all your dynamic tables
You can use Snowsight or the DYNAMIC_TABLES table function to view the refresh status for all your dynamic tables.
Sign in to Snowsight. In the navigation menu, select Transformation » Dynamic tables.
You can view the state and last refresh status for all your dynamic tables on this page. You can also filter by database or schema to narrow the results.
DYNAMIC_TABLES provides information about all of the dynamic tables in your account.
The following example retrieves the information about the state and target lag for all dynamic tables in the account and their associated database and schema.
The following example retrieves the state and information about each state for refresh for all dynamic tables in the account.
Monitor all the refreshes for a specific dynamic table
You can use Snowsight or the DYNAMIC_TABLES_REFRESH_HISTORY table function to view the refresh history for a given dynamic table.
Sign in to Snowsight.
In the navigation menu, select Transformation » Dynamic tables.
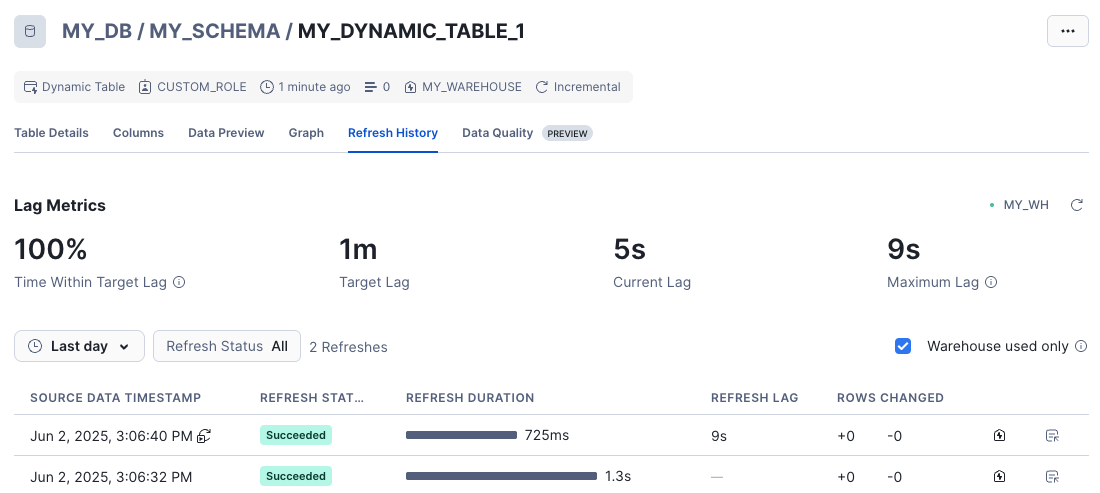
Select your dynamic table and then go to the Refresh History tab.
This page displays your dynamic table’s refresh history, which includes information about each refresh’s status, duration, and actual lag time, and the number of rows changed with each refresh.
It also displays your dynamic table’s lag metrics, which includes the percentage of the time within the target lag and the longest actual lag time during the given interval.
To view the refresh history for a specific dynamic table, use the DYNAMIC_TABLE_REFRESH_HISTORY table function.
For example, if you want to view the refresh history for all the dynamic tables in the my_db database and my_schema schema, execute
the following statement:
To filter for refreshes that had errors, pass in the argument ERROR_ONLY => TRUE. For example: