Analyzing query workloads with Performance Explorer
You can use Performance Explorer in Snowsight to review interactive metrics for SQL workloads. The metrics show the overall health of your Snowflake environment, query activity, changes to warehouses, and changes to tables.
Benefits of Performance Explorer
Performance Explorer can help you answer the following key questions about Snowflake activity:
- Overall activity: Are queries generally succeeding, and can Snowflake users get their work done?
- Change over time: If query activity or resources look different from what I expected, what has changed and when did the changes occur?
- Hot spots: When I look for opportunities to take action, where should I focus my attention?
Common use cases for Performance Explorer
Performance Explorer can help with the following use cases:
- Investigating problem reports about queries or workloads: If a Snowflake workload has started to behave differently, determine what else might have changed recently, such as the resources that the workload depends on or neighboring workload activity.
- Proactively identifying hotspots: If a warehouse or table shows persistent errors or saturation, identify and address the hotspot before it affects critical workloads.
- Identifying optimization opportunities: Find warehouses and tables that might be mismatched to the query activity they support, and adjust workloads and resources to make them compatible.
Required privileges
Performance Explorer shows account activity that is similar to data in Account Usage views (for example,
query history and
access history). What you can see in each part of the
dashboard depends on your privileges. Snowflake grants the SNOWFLAKE.PERFORMANCE_EXPLORER_PUBLIC_USER
application role to the PUBLIC role so that users can open Performance Explorer in Snowsight;
the following rules determine whether sections show full account data, filtered data, an empty state, or a
permission error.
Note
For Performance Explorer, Snowflake evaluates privileges from all roles granted to you. This is
equivalent to USE SECONDARY ROLES ALL on top of your active primary role for the session.
Full access to Performance Explorer data in the account
You have full access to Performance Explorer data for your account when any role granted to you meets one of the following conditions:
- Your role is the ACCOUNTADMIN role.
- Your role has been granted
IMPORTED PRIVILEGESon the sharedSNOWFLAKEdatabase (see Enabling other roles to use schemas in the SNOWFLAKE database). - Your role has been granted the
SNOWFLAKE.PERFORMANCE_EXPLORER_USERapplication role.
For example, to give the user jdoe full Performance Explorer access by using a custom role, run:
Seeing query metrics without full account access
If you do not have full access as described above, you can still see query activity when any role granted to you satisfies one of the following:
- Your role has been granted the
GOVERNANCE_VIEWERdatabase role in theSNOWFLAKEdatabase (account-wide query activity). - Your role has the
MONITORprivilege on the account, or theMANAGE WAREHOUSESprivilege on the account, which effectively covers all warehouses (query activity that uses warehouses). - Your role has
OWNERSHIP,MONITOR, orOPERATEon at least one warehouse (query activity only for queries that ran on warehouses you can monitor or operate). For details, see Warehouse privileges.
If none of the above apply and you cannot MONITOR or OPERATE any warehouse, Performance Explorer
shows a permission error for query activity. This is intentional: without at least one authorized warehouse,
no query metrics would be visible. In practice, many accounts include a default warehouse that all users
can monitor; see Snowsight templates.
Warehouse filters list warehouses you are allowed to use in filters (for example, warehouses you can
MONITOR or OPERATE, and in some cases warehouses that had query activity in the retention window).
Warehouse-scoped visibility is similar in spirit to the rules for Query History in
Monitor query activity with Query History, but Performance Explorer uses all roles granted to you and
combines several privilege types, so the exact rules differ.
Database filters and database-oriented breakdowns
To see all databases in database filters (and related aggregations by database), any role granted to you must satisfy one of the following:
- Your role meets the conditions for full access to Performance Explorer data in the account (see the preceding section).
- Your role has been granted the
OBJECT_VIEWERdatabase role in theSNOWFLAKEdatabase. - Your role has
RESOLVE ALLon the account. - Your role has
MONITORon the account.
Otherwise, you only see databases where any role granted to you has at least one privilege on the database. Queries can still appear in other sections even if they touch a database you cannot list, except where the UI explicitly names databases (for example, certain side-panel breakdowns).
Warehouse events
To see warehouse events for all warehouses that appear in your authorized query activity, any role granted to you must satisfy one of the following:
- Your role meets the conditions for full access to Performance Explorer data in the account (see the preceding section).
- Your role has been granted the
USAGE_VIEWERdatabase role in theSNOWFLAKEdatabase. - Your role has the
MONITORprivilege on the account. - Your role has the
MANAGE WAREHOUSESprivilege on the account.
Otherwise, warehouse events are limited to warehouses where you have OWNERSHIP,
MONITOR, or OPERATE. If you have none of those warehouse privileges or usage-related database
roles, Performance Explorer shows a permission error for warehouse events.
Top tables and table change events
The Top tables section and table change events require full access or the GOVERNANCE_VIEWER
database role in the SNOWFLAKE database. Snowflake does not offer a lower-privilege, per-table
alternative for these sections due to security and performance constraints. If you do not meet this bar,
those sections show a permission error.
Empty charts, filtered results, and permission errors
For security reasons, an empty chart or table can mean either that there was no activity in the selected period or that your roles cannot see that activity. Tile-level permission errors call out missing privileges (for example, governance visibility for table metrics).
Privilege changes and data freshness
Updates to grants and revocations can take a few hours to affect what Performance Explorer shows.
Open Performance Explorer
To open Performance Explorer, complete the following steps:
- Sign in to Snowsight.
- In the navigation menu, select Monitoring » Performance Explorer.
Performance Explorer contains charts that show metrics related to your workloads and the general health of your Snowflake environment.
To leave feedback about Performance Explorer, select Feedback.
Understanding the Performance Explorer dashboard
You can review interactive metrics for SQL workloads by using charts on the Performance Explorer dashboard, and you can apply filters to show metrics about only the query activity and resources that you’re interested in. Charts are grouped under tabs (Queries, Warehouses, and Tables). The page URL updates when you change tabs, and the same tab stays selected if you refresh the page.
Performance Explorer filters
At the top of the Performance Explorer dashboard, you can apply the following filters:
-
Preset - Choose None or a saved combination of period, warehouse, database, and role filters. From the menu you can save the current filters as a new preset, clear all filters, copy a link that encodes the current filters, and manage saved presets (for example set or change a default preset).
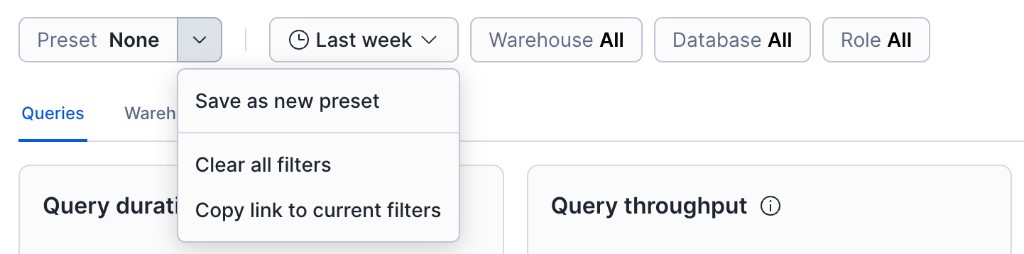
-
Period - Select a time period, such as the last week, the last two weeks, or a custom range. The dashboard shows metrics for the specified period.
Performance Explorer displays metrics for one week by default. It supports a period of up to one month, going back from the current date.
Several Performance Explorer charts show the percentage of change compared to the previous period. The range of the previous period corresponds with the current period range. For example, if the current period is two weeks, then the previous period is the two weeks before the current period started.
-
Warehouse - Select a warehouse to view metrics only for query activity that ran using that warehouse. To limit the warehouses in the list, use the search field. To clear the filter, select
X. -
Database - Select a database to view metrics only for query activity that accessed that database. To limit the databases in the list, use the search field. To clear the filter, select
X. -
Role - Select a role to view metrics only for query activity initiated by that role. To limit the roles in the list, use the search field. To clear the filter, select
X.
Performance Explorer charts
Performance Explorer displays metrics in different types of charts. It is important to understand the components in each type of chart and how to interpret them.
On the Queries tab, line chart metrics use line charts that are similar to the following image:
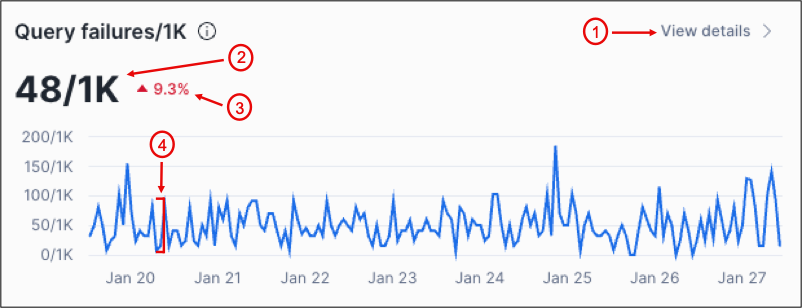
The following table describes the callouts in the image:
| Callout | Description |
|---|---|
| 1 | Select View details > to open the side panel. View details > appears when you hover over a chart. |
| 2 | Shows the average or median in the period. |
| 3 | Shows the percentage increased or decreased compared to the previous period. |
| 4 | Represents the value for one hour. The values are shown for an amount of time at the start of the interval. For example, if the interval is one hour, the value shown at 9 AM is for the interval from 9 AM to 10 AM. |
Some charts include a large average or median value and the percentage of change for the period. When there is more than one line, there is a key to the lines above the chart.
Some charts have an information icon next to the title. Hover over the icon for information about the metrics in the chart.
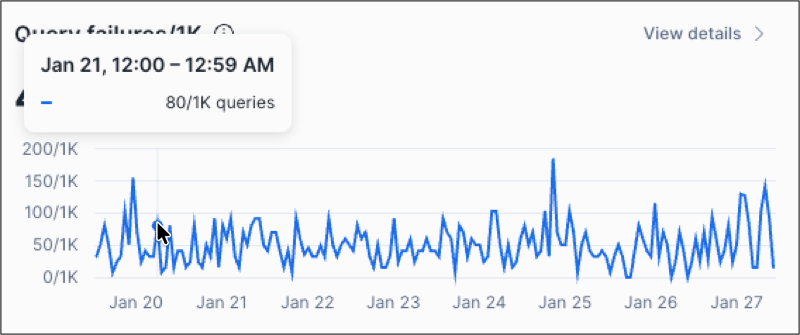
You can hover over a point in the line chart to see the value for a specific hour:
The Top warehouses section on the Warehouses tab and the Top tables section on the Tables tab have bar charts that are similar to the following image:
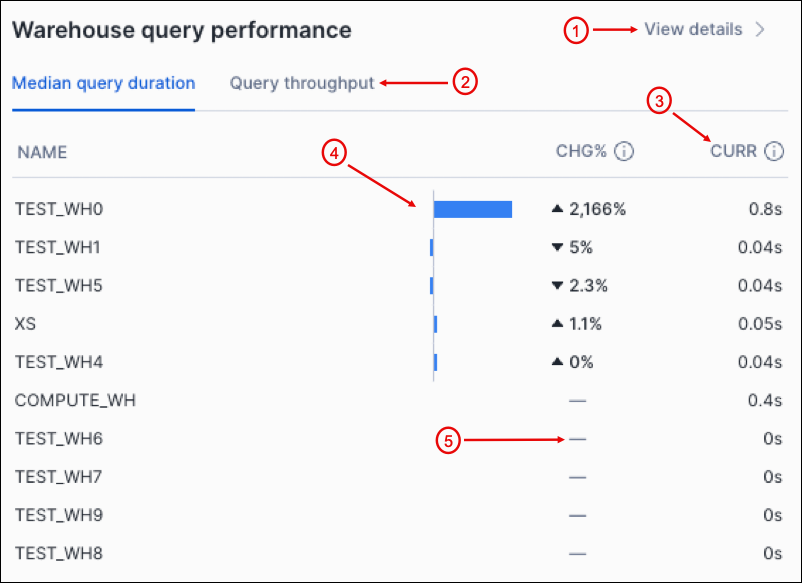
The following table describes the callouts in the image:
| Callout | Description |
|---|---|
| 1 | Select View details > to open the side panel. View details > appears when you hover over a chart. |
| 2 | Select a tab to show the metrics on the tab. |
| 3 | Shows the value of this metric for the current period. |
| 4 | Shows the percentage increased or decreased compared to the previous period. |
| 5 | Indicates that there is no data from the previous period for comparison. |
On both line charts and bar charts, select View details > to open a side panel that displays more detailed information about the metrics on the chart. The detailed information varies based on the metrics shown in the chart. Most side panels present sortable tables that you can use to review metrics for specific warehouses, roles, databases, and queries in the period.
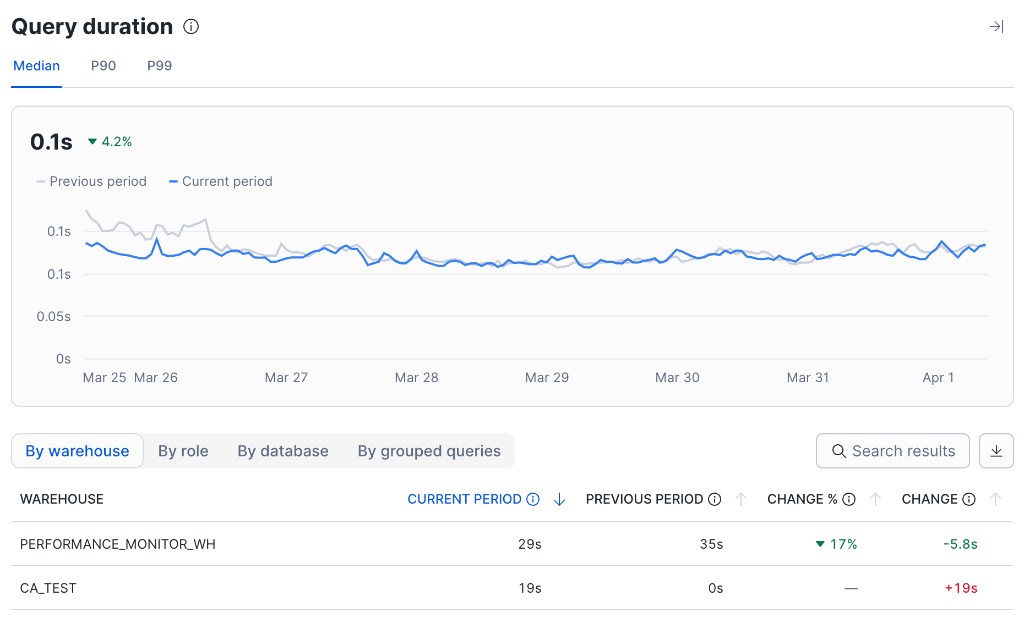
Use the Search results field above the table to filter rows; search is case-insensitive and applies across the side-panel aggregation tabs (for example, By warehouse and By role). Select the download control to export the table as a CSV file. The downloaded file name reflects the chart and the active dashboard filters.
You can select a custom period of time in a side panel by clicking where the custom period starts and dragging to where the custom period ends.
In a side panel, you can select one of the following tabs:
- By warehouse - Shows the activity by warehouses in the period.
- By database - Shows the activity by databases in the period.
- By role - Shows the activity by roles in the period.
- By grouped queries - Shows the queries that were run in the period. Some queries are redacted for security reasons. For information about how queries are grouped, see Use the Grouped Query History view in Snowsight.
If you select a custom period, these tabs refresh to show the metrics only for the selected custom period.
The Top warehouses and Top tables sections also include events charts that are similar to the following image:
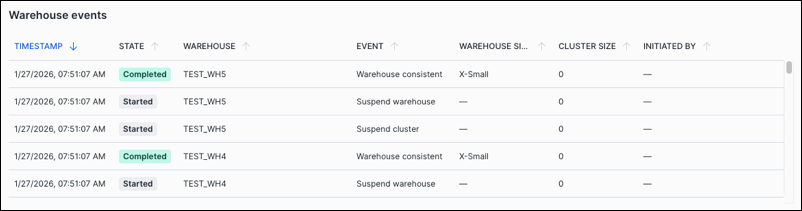
An events chart shows a sortable table of events for the type of object. You can examine the data for unexpected events. For more information about warehouse events, see WAREHOUSE_EVENTS_HISTORY view. For more information about table events, see TABLES view.
Reviewing metrics on the Queries tab
On the Queries tab, line charts cover reliability signals (failures, retries, overload, blocking) and runtime signals (duration, throughput, wait time, and hourly failure counts). Use them to review trends over the selected period. Performance Explorer summarizes historical windows for your account; it is not a live monitoring dashboard.
The following line-chart metrics are available on the Queries tab:
| Metric | Unit | Description | Notes | More information |
|---|---|---|---|---|
| Query failures/1K | Failures per 1000 | The number of queries that failed for every 1,000 queries that ran, including the following metrics:
| This metric should be low or zero. If queries are failing, review the query history and errors, and then modify your queries to resolve the issues. | Monitor query activity with Query History |
| Query retries/1K | Retries per 1000 | The number of queries that were retried for every 1,000 queries that ran, including the following metrics:
| This metric should be low or zero. If queries are retrying, review the causes, and then take actions to prevent query retries. For example, if a query is retried because of an out-of-memory error, modifying warehouse settings might resolve the issue. | QUERY_HISTORY view |
| Query overload % | Percent | The percentage of total run time that queries waited in a queue for warehouse resources, including the following metrics:
| This metric should be low or zero. If queries are waiting before running, warehouse resources might be exhausted, causing queries to be queued until resources become available. | Reducing queues |
| Query blocked % | Percent | The percentage of total run time that queries spent blocked waiting for a transaction lock on a resource, including the following metrics:
| This metric should be low or zero. If queries were blocked, review the query history and errors, and then modify your queries to resolve the issues. | Resource locking |
| Query duration | Seconds | The amount of time it took for queries to complete for each hour of the period. The line chart shows the median amount of time for all queries, the amount of time for queries in the ninetieth percentile, and the amount of time for queries in the ninety-ninth percentile. | This metric varies widely depending on your data and the types of queries you are running. Queries with durations that change over time might be candidates for investigation and optimization. | |
| Query throughput | Queries | The number of queries that ran each hour. | This metric can reveal changes in query activity, which might indicate new trends or changes in your workloads. | Optimizing warehouses for performance |
| Query wait time | Seconds | The amount of time that queries waited for warehouse resources or because of a lock on a resource. For information about the states (Overload, Provisioning, Repair, and Blocked), see QUERY_HISTORY view. | This metric should be low or zero. If queries are waiting before running, warehouse resources might be exhausted, causing queries to be queued until resources become available. | |
| Query failures | Failures | The number of queries that failed for each hour in the period. | This metric should be low or zero. If queries are failing, review the query history and errors, and then modify your queries to resolve the issues. | Monitor query activity with Query History |
Reviewing top warehouses
On the Warehouses tab, this section of Performance Explorer includes metrics about the warehouses in your Snowflake environment that experienced the most changes in the period. You can review these metrics to see whether your warehouses are functioning as expected to support query activity. The metrics can also show whether any warehouses are associated with trends in query activity that are unusual when compared to other warehouses. You can also determine whether the composition of the workloads that warehouses run have changed.
All metrics in this section show the metric value and the percentage of change since the last period. The percentage of change can be positive or negative, with positive change represented by an up arrow and negative change represented by a down arrow. For each metric, Performance Explorer shows the 10 warehouses with the most changes. To view metrics for more warehouses, select View details > on a chart to open the side panel. If this metric has no value from the last period for a warehouse, --- is shown instead of the percentage of change. There might be no value because the warehouse is new, or because the event being measured is infrequent.
This section includes the following metrics:
| Metric | Tab | Unit | Description | Notes | More information |
|---|---|---|---|---|---|
| Warehouses with errors | Query failures/1K | Failures per 1000 | For each warehouse, the number of queries that failed for every 1,000 queries that ran. | This metric should be low or zero. If queries are failing, review the query history and errors, and then modify your queries to resolve the issues. | Monitor query activity with Query History QUERY_HISTORY view |
| Query OOM errors/1K | Errors per 1000 | For each warehouse, the number of queries that returned “out of memory” errors for every 1,000 queries that ran. | This metric should be low or zero. If queries are failing with “out of memory” errors, review the query history to determine which queries are failing for the warehouses, and then modify the warehouses that run the queries to avoid the errors. | Monitor query activity with Query History QUERY_HISTORY view Queries too large to fit in memory | |
| Query retries/1K | Retries per 1000 | For each warehouse, the number of queries that were retried for every 1,000 queries that ran. | This metric should be low or zero. If queries are retrying because warehouses are running out of memory, review the query history to determine which queries are retrying for the warehouses, and then modify the warehouses that run the queries to avoid the errors. | Monitor query activity with Query History QUERY_HISTORY view Optimizing warehouses for performance | |
| Warehouses with spillage | % queries with bytes spilled | Percent | For each warehouse, the percentage of queries that spilled to local disk or remote cloud storage when they ran. | This metric should be low or zero. If queries are spilling to disk because warehouses are running out of memory, review the query history to determine which queries are spilling for the warehouses, and then modify the warehouses that run the queries to avoid the errors. | Monitor query activity with Query History QUERY_HISTORY view Queries too large to fit in memory |
| % bytes spilled of total | Percent | For each warehouse, the percentage of bytes that spilled to local disk or remote cloud storage when they ran compared with the number of bytes read. | This metric should be low or zero. If queries are spilling to disk because warehouses are running out of memory, review the query history to determine which queries are spilling for the warehouses, and then modify the warehouses that run the queries to avoid the errors. | Monitor query activity with Query History QUERY_HISTORY view Queries too large to fit in memory | |
| Query wait time % | Overload % | Percent | For each warehouse, the proportion of total run time that queries waited because the warehouse was overloaded by the query workload. | This metric should be low or zero. If queries are waiting before running, warehouse resources might be exhausted, causing the warehouse to queue queries until resources become available. | Reducing queues |
| Provisioning % | Percent | For each warehouse, the average proportion of total run time that queries waited for warehouse compute resources to provision, due to warehouse creation, resume, or resize. | This metric should be low or zero. If queries are waiting before running, warehouse resources might be exhausted, causing it to queue queries until resources become available. | Reducing queues | |
| Warehouse query performance | Median query duration | Seconds | For each warehouse, the median amount of time for queries to run. | This metric varies widely depending on your data and the types of queries you are running. If the median query duration shows unusual changes, the workload that this warehouse supports might have changed, or the warehouse configuration might have changed. | Exploring execution times Optimizing query performance |
| Query throughput | Queries | For each warehouse, the number of queries processed. | This metric can reveal changes in query activity, which might require modifications to the warehouses that run the queries. | Optimizing warehouses for performance | |
| Warehouse events | – | None | A sortable table of warehouse events. | This metric shows which warehouses changed in the period. Examine the data for unexpected events. | WAREHOUSE_EVENTS_HISTORY view |
Reviewing top tables
On the Tables tab, this section of Performance Explorer includes metrics about the tables in your Snowflake environment that experienced the most changes in the period. You can review these metrics to see whether your tables can support query activity and return data as expected. The metrics can also show whether any tables are associated with trends in query activity that are unusual when compared to other tables. You can also determine whether any tables have changed recently and how they have changed.
All metrics in this section show the metric value and the percentage of change since the last period. The percentage of change can be positive or negative, with positive change represented by an up arrow and negative change represented by a down arrow. For each metric, Performance Explorer shows the 10 tables with the most changes. To view metrics for more tables, select View details > on a chart to open the side panel. If this metric has no value from the last period for a table, --- is shown instead of the percentage of change. There might be no value because the table is new or because the event being measured is infrequent.
This section includes the following metrics:
| Metric | Tab | Unit | Description | Notes | More information |
|---|---|---|---|---|---|
| Table query failures/1K | – | Failures per 1000 | For each table, the number of queries that failed for every 1,000 queries that ran. | This metric should be low or zero. If queries are failing, review the query history and errors, and then modify your queries to resolve the issues. | Monitor query activity with Query History QUERY_HISTORY view |
| Table queries blocked/1K | – | Blocked per 1000 | For each table, the number of queries that were blocked for every 1,000 queries that ran. | This metric should be low or zero. If queries were blocked, review the query history and errors, and then modify your queries to resolve the issues. | Resource locking Best practices for transactions LOCK_WAIT_HISTORY view Monitor query activity with Query History QUERY_HISTORY view |
| Table read performance | Median read query duration | Seconds | For each table, the median amount of time for queries to run. | This metric varies widely depending on your data and the types of queries you are running. Queries with durations that change over time might be candidates for investigation and optimization. | Exploring execution times Optimizing query performance |
| Read query throughput | Queries | For each table, the number of queries processed. | This metric can reveal changes in query activity for tables. If there is an increase in the number of queries for a table, you might want to modify the table to optimize query performance. For example, you might enable search optimization on the table. | Table Design Considerations Optimizing query performance | |
| Table write performance | Median write query duration | Seconds | For each table, the median amount of time for Data Manipulation Language (DML) operations to run. | This metric varies widely depending on your data and the types of DML operations you are running. DML operations with durations that change over time might be candidates for investigation and optimization. | Exploring execution times Optimizing query performance |
| Write query throughput | Queries | For each table, the number of DML operations processed. If there is an increase in the number of DML operations for a table, you might want to modify the table to optimize performance. | This metric can reveal changes in the number of DML operations. | Table Design Considerations | |
| Table change events | – | None | A sortable table of table events. | This metric shows which tables changed in the period. Examine the data for unexpected events. | TABLES view |