Spark Monitoring UI
The Spark Monitoring UI provides a view of Snowpark Connect for Spark usage and history across your Snowflake account. This UI consolidates the relevant information from each Snowpark Connect for Spark job or interactive session to aid in monitoring and troubleshooting.
Batch jobs from snowpark-submit and EXECUTE CODE BUNDLE appear under the Batch Jobs tab. That includes Spark jobs whose specification sets type: spark, and scheduled notebooks that initialize a Snowpark Connect session. Each run shows status, duration, name, and owner. Any Snowpark Connect session connection is tracked under the Spark Sessions tab with its queries and owner.
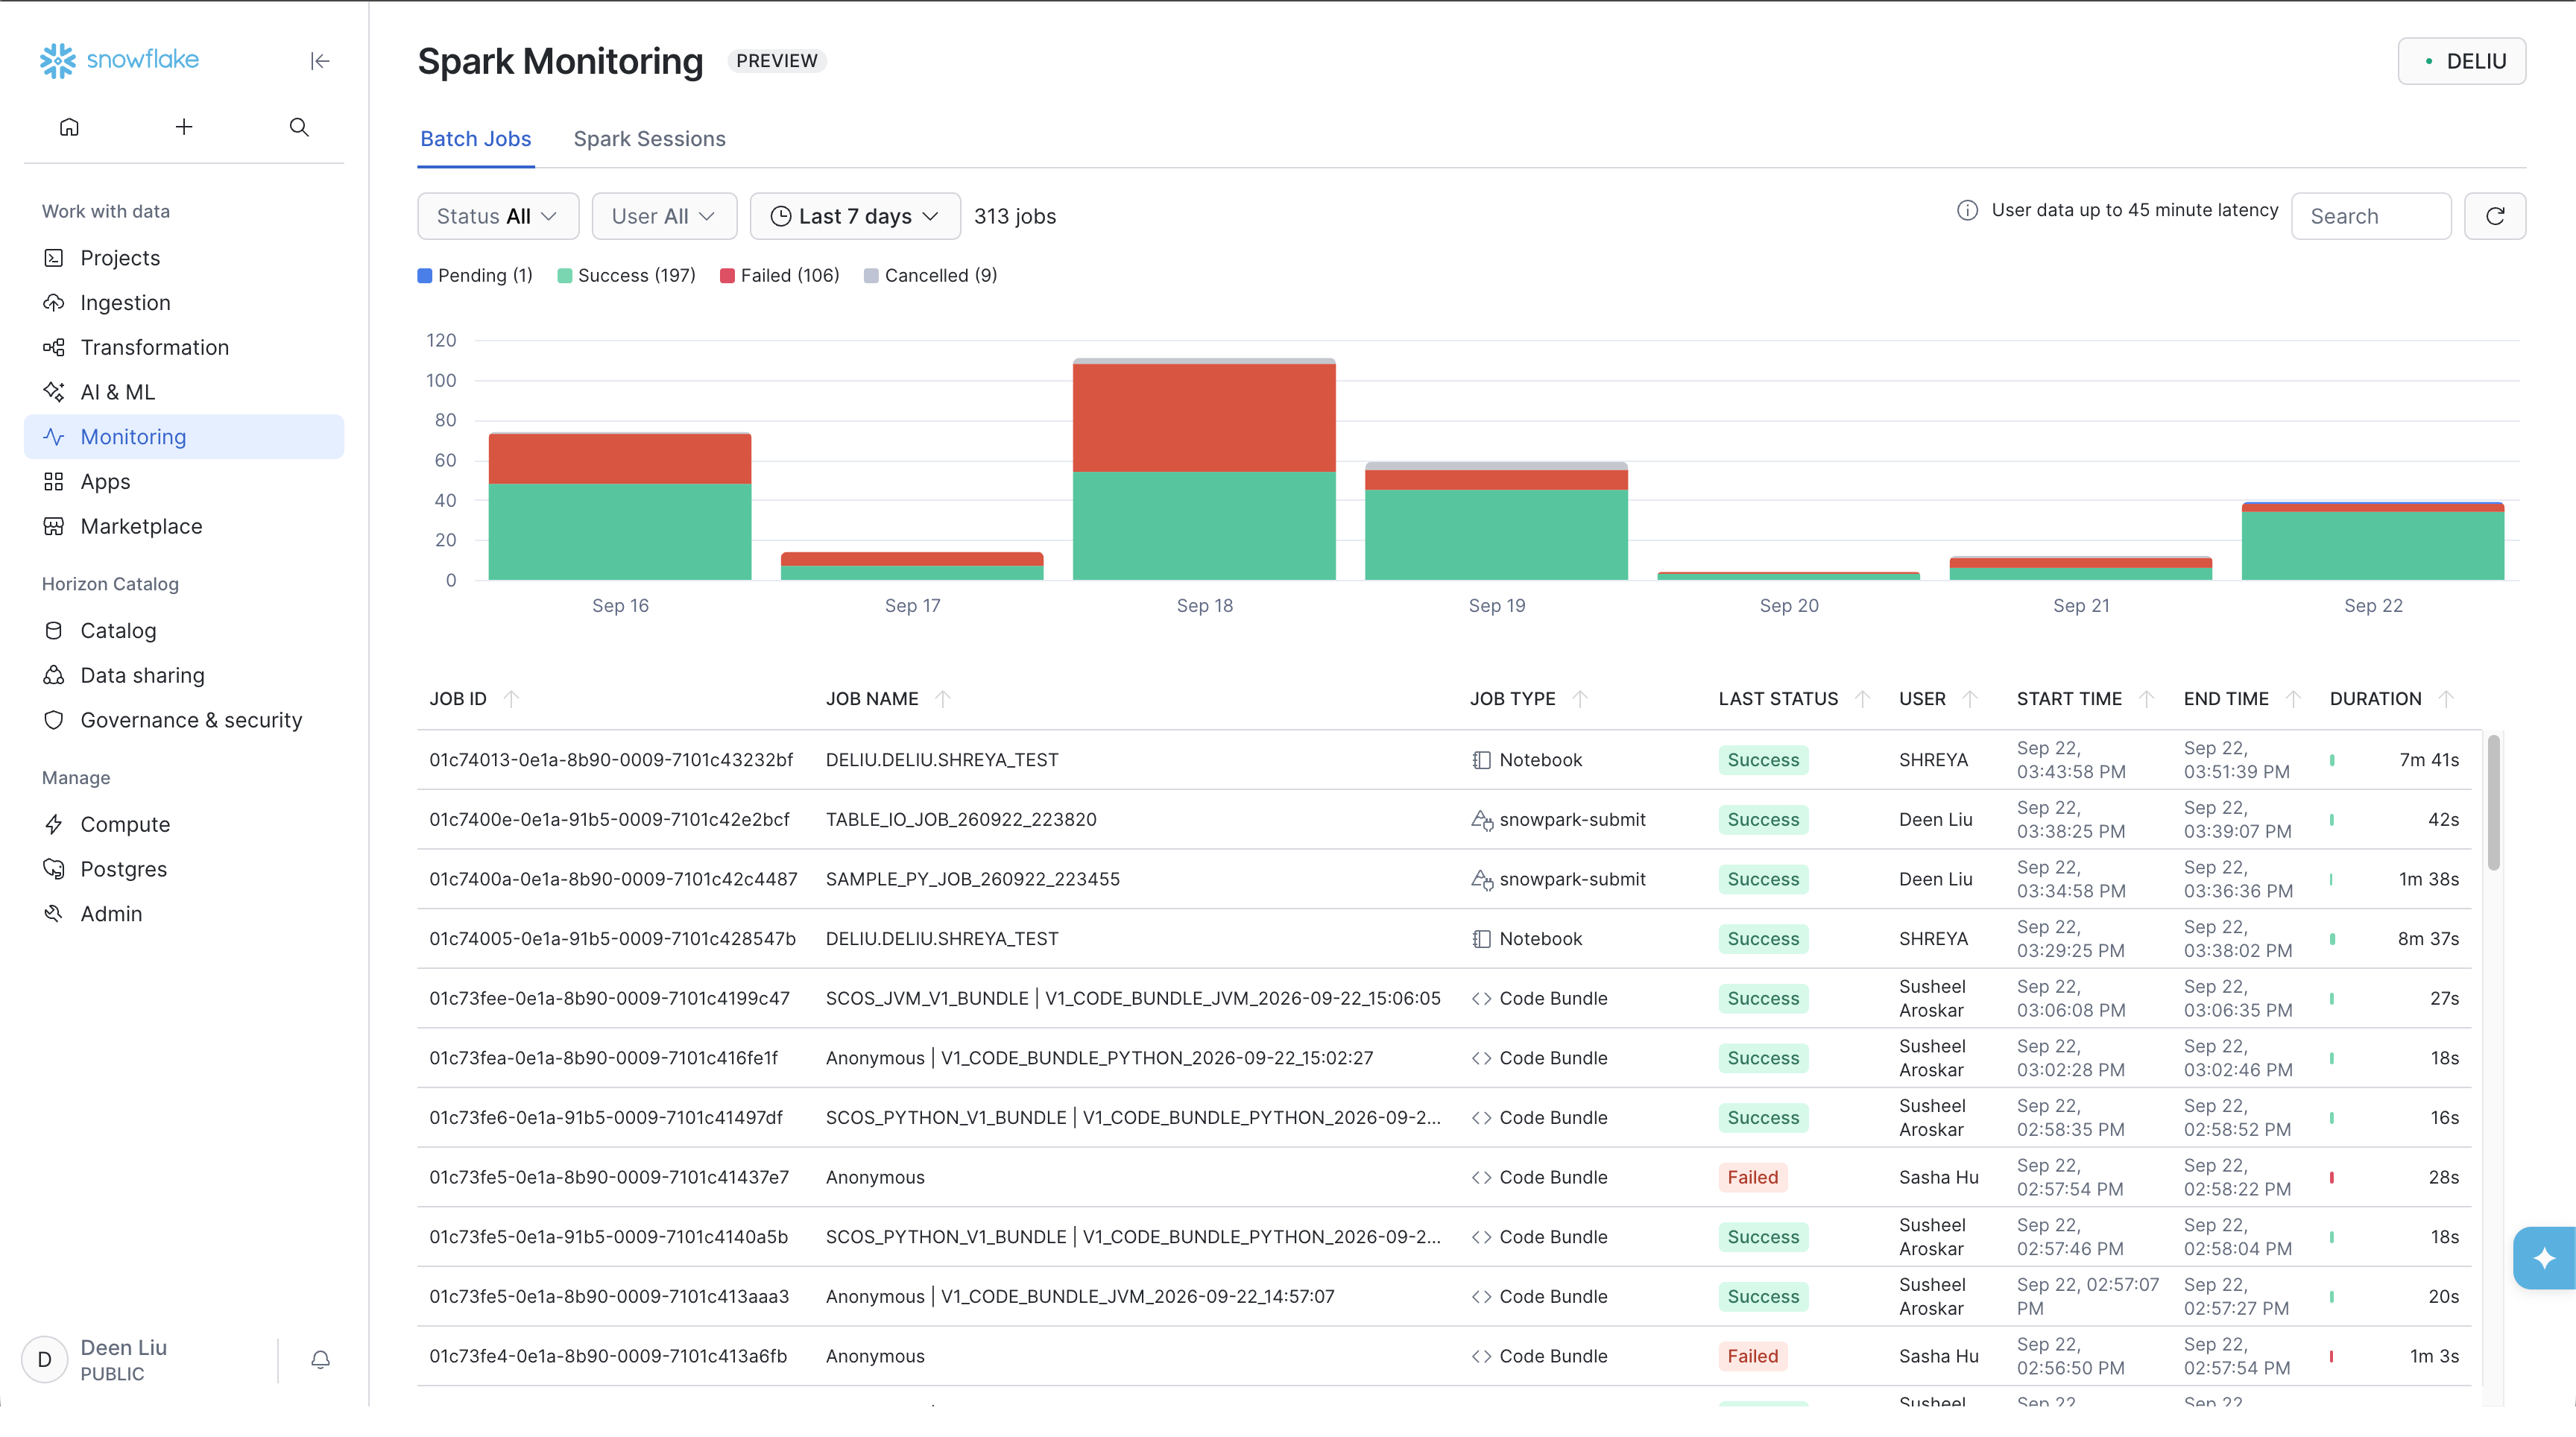
The following sections cover how to open the page and how each tab behaves.
Open Spark Monitoring UI
- Sign in to Snowsight.
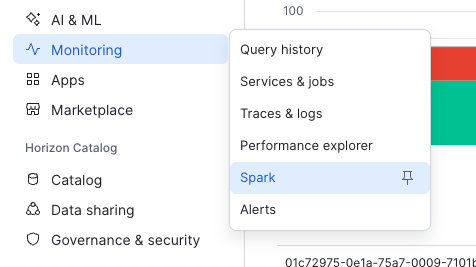
- Select Monitoring » Spark.
Batch Jobs Tab
The Batch Jobs tab lists three kinds of batch-style Snowpark Connect for Spark executions for your account:
snowpark-submitrunsEXECUTE CODE BUNDLEruns whose specification setstype: sparkEXECUTE CODE BUNDLEruns for scheduled notebooks that initialize a Snowpark Connect session
For each run you can see duration, who submitted the job, and status.
Batch Job Details Page
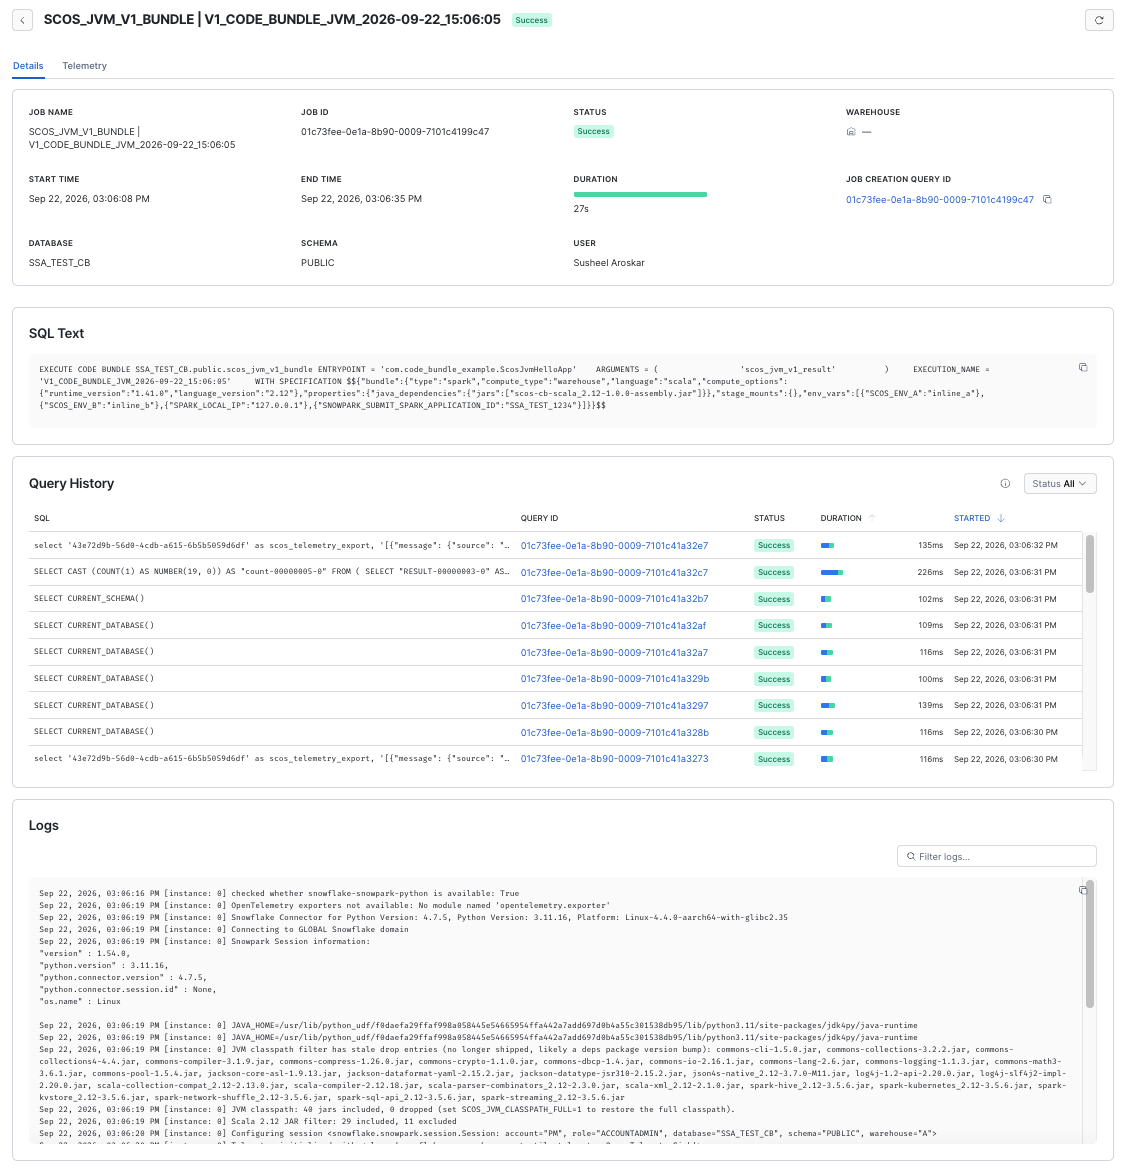
Select a row to open the details view for that run. The details include:
- The
snowpark-submitcommand line or the SQL command that was executed - Queries associated with the job
- Log output
- An OpenTelemetry trace for the job
For log and event-table behavior for submit workloads, see Monitoring Snowpark Connect for Spark workloads.
Note
The Logs section shows log records that were ingested into your event table, which is controlled by the LOG_LEVEL
parameter. Set LOG_LEVEL to any level other than OFF and the Logs section shows records at that level and more
severe — for example, INFO shows INFO, WARN, ERROR, and FATAL, while WARN shows WARN and more severe. Set
LOG_LEVEL at the scope that matches your event table: at the account level if you use an account-level event
table, or at the database level if the job’s database uses a database-level event table. If LOG_LEVEL is OFF,
the Logs section is empty even when the run succeeds. For more information, see
Setting levels for logging, metrics, and tracing.
Batch Job Trace Tab
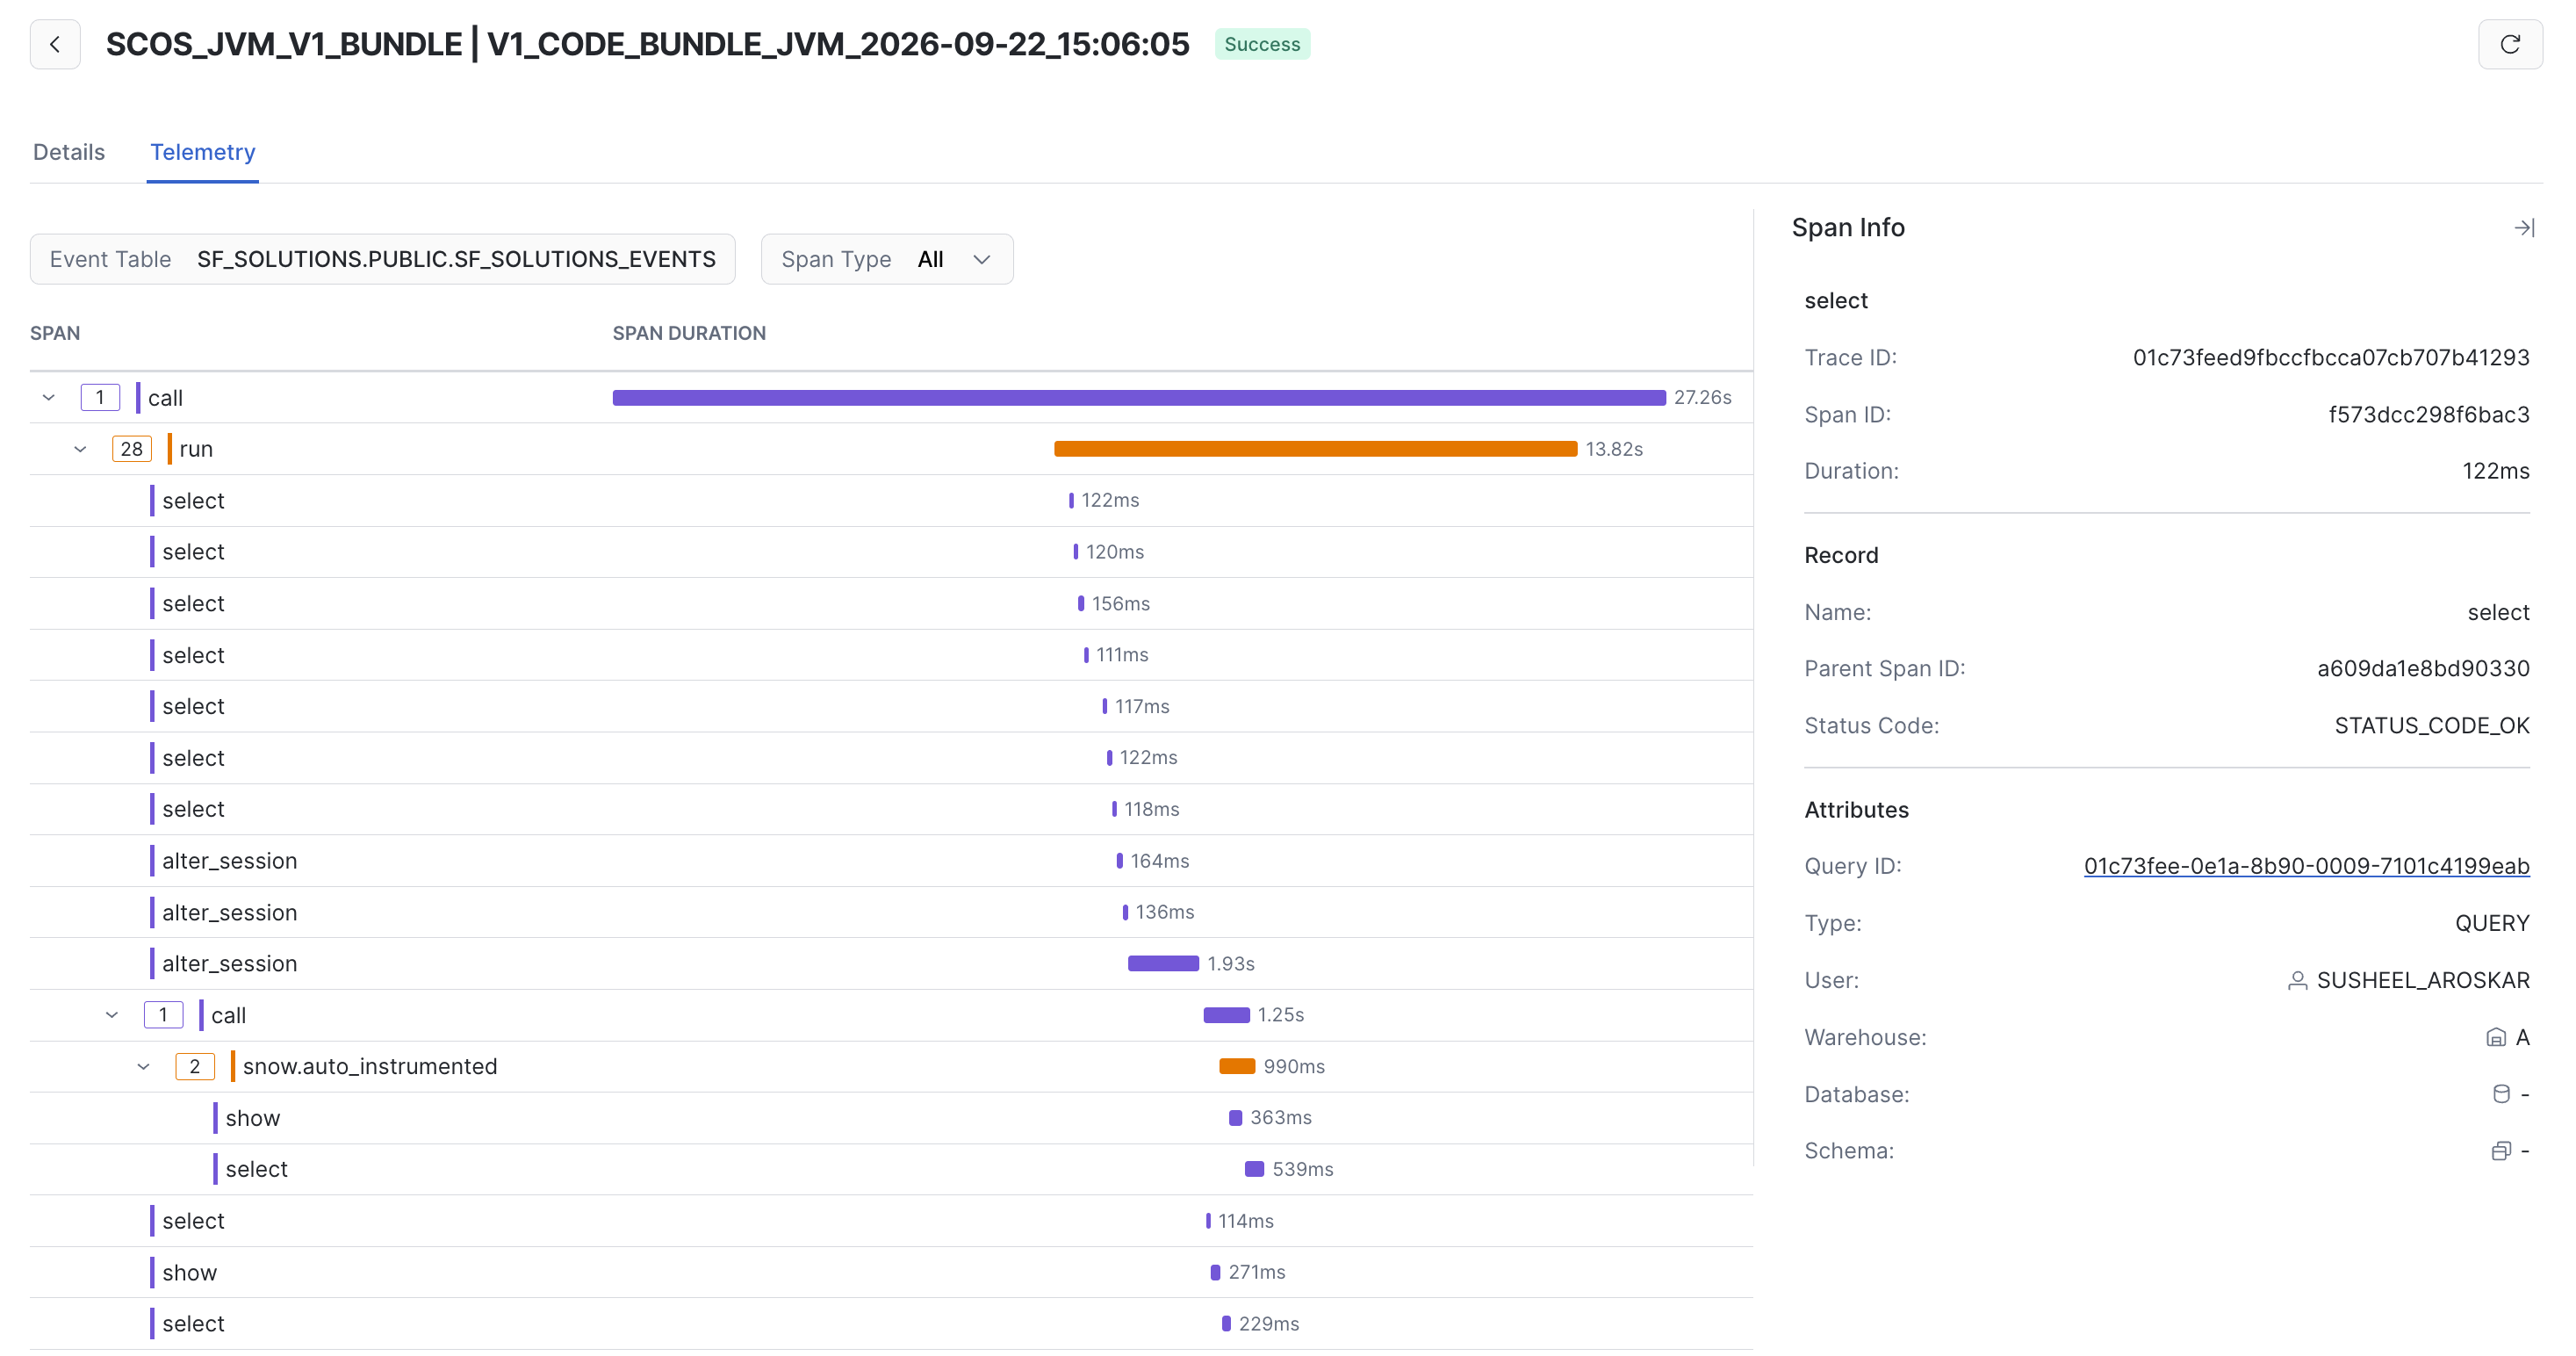
The Trace tab on the Details page shows an OpenTelemetry trace of the job execution. Each DataFrame action is represented by a span, and the associated queries for each of those DataFrame actions is shown as a child span. This can help you more easily visualize the portions of your job that are taking the longest to run, and more easily get to the Query Profile for any slow or failed DataFrame actions.
For how trace data is represented and how to view or query it in your event table, see Viewing trace data.
Spark Sessions Tab
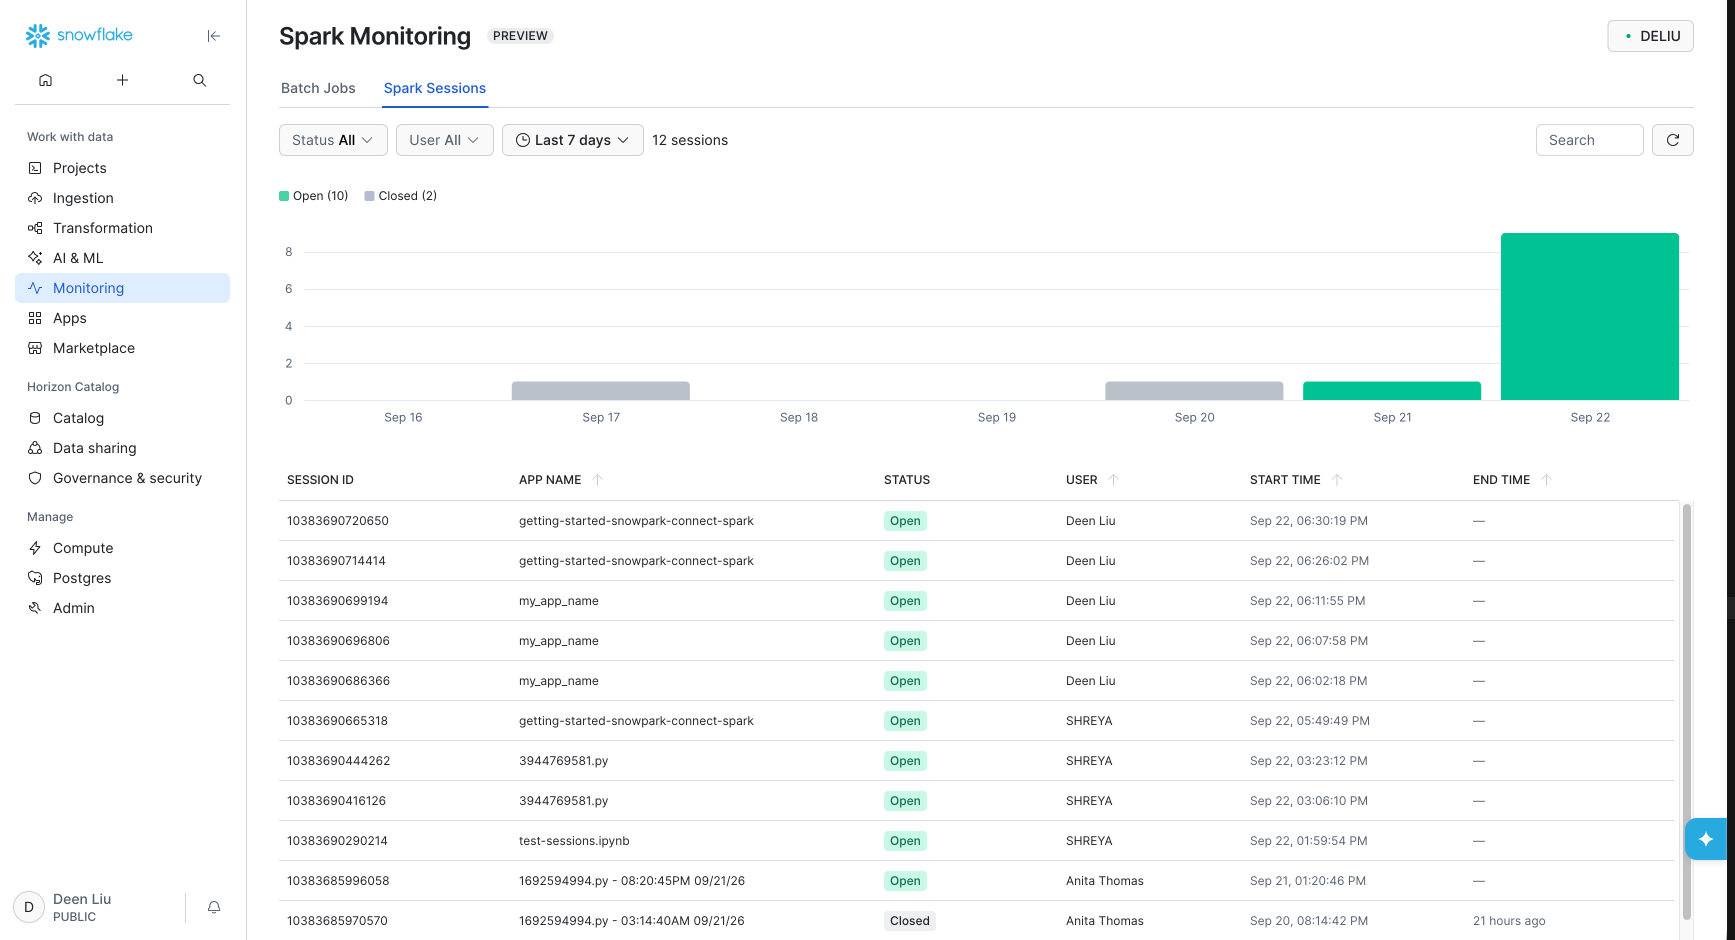
The Spark Sessions tab lists Snowpark Connect for Spark client sessions that have connected to your account. That includes sessions from local laptops, Snowflake Notebooks, Snowflake Workspaces, and other supported clients.
For each session, Snowsight shows when the session started, who started it, the session ID, and the session name.
Spark Session Details Page
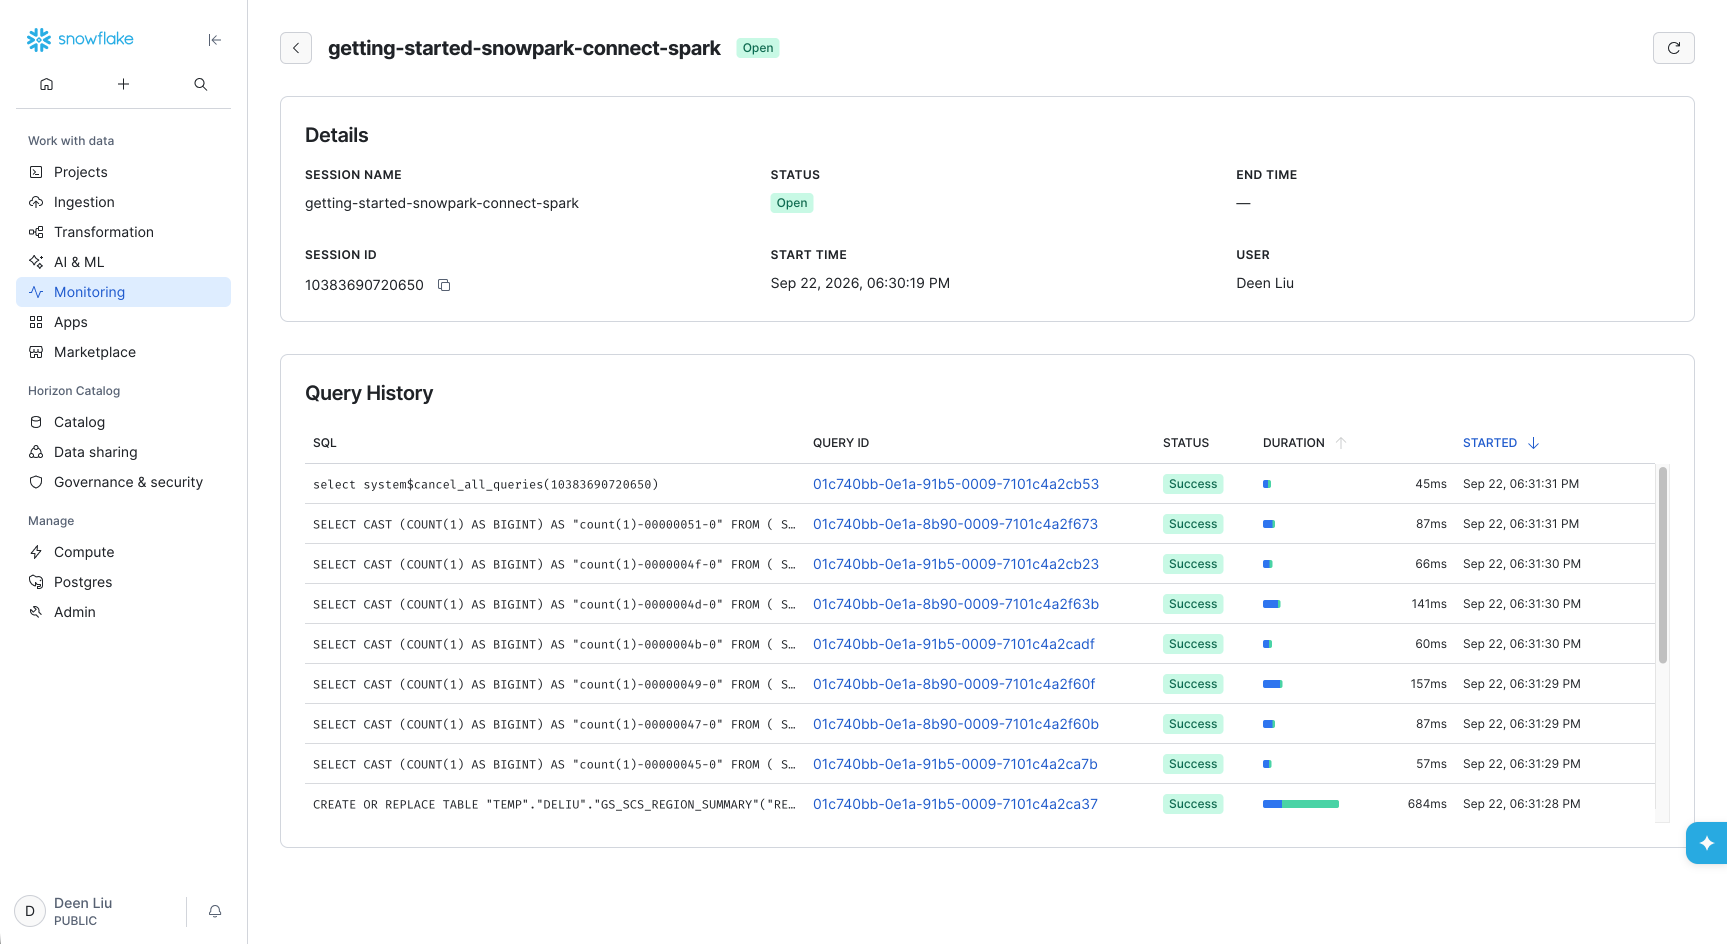
The details page for a Spark Session shows all of the Queries issued from that session. Clicking the Query ID for one of these queries will take you to the Query Profile, which you can use to debug long or failed queries.
Setting the App Name
The app name comes from the app_name argument when you call init_spark_session. If you set app_name, that value appears as the session name in Snowsight.
In this example, my_app_name is shown as the session name.
If you do not pass app_name, Snowpark Connect uses the file name where the session was created as the app_name (for example main.py). For how the Python API derives the default application name, see the app_name parameter on init_spark_session.
Limitations
- For a scheduled Snowflake Notebook run (
EXECUTE CODE BUNDLEwithtype: custom), the run only appears in the Batch Jobs tab once the notebook code callssnowflake.snowpark_connect.init_spark_session()to start a Snowpark Connect session. If your notebook initializes the session late in its execution, there can be a lag between when the notebook actually starts and when Snowpark Connect for Spark registers it as a Spark job in Batch Jobs.