Analyze Workload Performance with CoCo
The workload-performance-analysis bundled skill in Cortex Code analyzes
Snowflake SQL query execution using ACCOUNT_USAGE views. You ask questions in natural
language; the skill queries historical performance data, summarizes what it finds, and can suggest next steps.
The skill is built into Cortex Code. You don’t install or configure it separately.
Overview
Use this skill when you need to understand how queries ran and what to tune next: spilling, partition pruning, cache efficiency, clustering, and eligibility for Search Optimization Service (SOS) or Query Acceleration Service (QAS).
The skill is a single entry point for performance analysis. Depending on what you ask, it focuses on a specific query, warehouse, table, query pattern, stored procedure run, a set of queries, or a broad account health scan.
When the skill applies
Cortex Code selects workload-performance-analysis when your request matches performance analysis topics such as:
- Spilling, memory pressure, or spill to local or remote storage
- Partition pruning, scan volume, or tables that prune poorly
- Cache hit rates or warehouse cache efficiency
- Clustering keys,
CLUSTER BY, or predicate columns for clustering or SOS - Search optimization or SOS candidates
- Query Acceleration Service (QAS) or acceleration eligibility
- Slow SQL diagnosis, bottlenecks, root cause, or concurrency issues
- Per-warehouse spill, prune, or cache metrics
What this skill is not for
Use other Cortex Code skills for the following topics:
| Topic | Use instead |
|---|---|
| Cost, credits, or spend analysis | cost-intelligence |
| Access audit or data governance | data-governance |
| Writing, editing, or debugging your SQL | General Cortex Code assistance outside this skill |
What the skill can do
The skill analyzes SQL query performance using ACCOUNT_USAGE views. It can help you:
- Disk spilling: Find queries with excessive local or remote spilling and suggest fixes.
- Partition pruning: Review pruning ratios and scan efficiency on large tables.
- Cache hit rates: Evaluate local disk cache and warehouse cache efficiency.
- Clustering keys: Recommend clustering keys when pruning is poor.
- Search Optimization Service (SOS): Identify workloads that may benefit from SOS.
- Query Acceleration Service (QAS): Find queries that may be eligible for QAS.
- Predicate analysis: Relate filter columns to clustering or SOS opportunities.
- Stored procedure runs: Analyze a parent
CALLand its child queries as one run. - Query sets and patterns: Compare multiple queries, recurring patterns, or filtered workloads.
Results are summarized with top findings first, not raw dumps of every row.
Questions the skill can help answer
- Which queries are spilling to disk, and should I upsize the warehouse or change the query?
- Is warehouse ANALYTICS_WH showing spill, prune, or cache problems across recent runs?
- Are scans on DB.SCHEMA.ORDERS pruning enough partitions?
- Which recurring query patterns are slowest or most expensive to execute?
- What happened inside this stored procedure run, including child queries?
- Are there SOS or QAS candidates in my recent workload?
- Give me a quick account-level performance health check (spilling, pruning, cache, QAS).
Be specific when you can: a query ID, warehouse name, fully qualified table name, time range, or symptom (for example “remote spilling on ANALYTICS_WH last 7 days”) helps the skill scope the analysis.
How deep the analysis goes
You control depth with how you phrase the request. The following table summarizes typical outcomes:
| You ask for | What you get |
|---|---|
| Summary, overview, quick look, health check | High-level findings; you can ask to go deeper afterward |
| What’s wrong, root cause, bottlenecks, why is X slow | Summary plus issue detection |
| Recommend, how to fix, optimize, action items | Summary, detection, and concrete recommendations |
If you don’t specify depth, the skill starts with a summary and offers deeper analysis or recommendations.
Where you can use the skill
The skill is available in four places. In Snowsight, select Analyze with CoCo to pass page context to the skill.
In Cortex Code CLI, Cortex Code Desktop,
or the Cortex Code panel in Snowsight, describe what to analyze or
invoke /workload-performance-analysis.
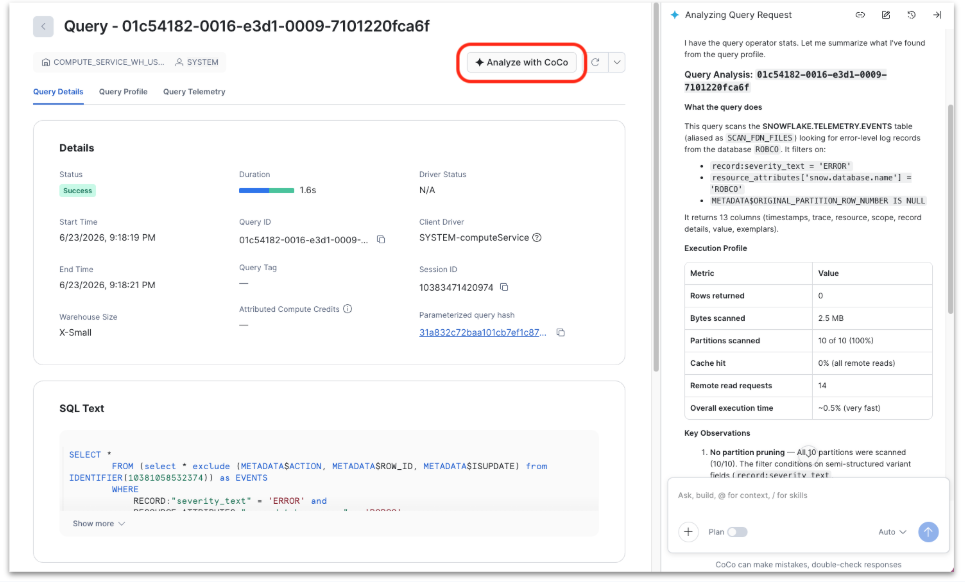
Query Details
From a single query’s detail view in Snowsight, select Analyze with CoCo. Cortex Code receives that
query’s context and analyzes that execution (including stored procedure runs when the query is a CALL). For more
information, see Review details and profile of a specific query.
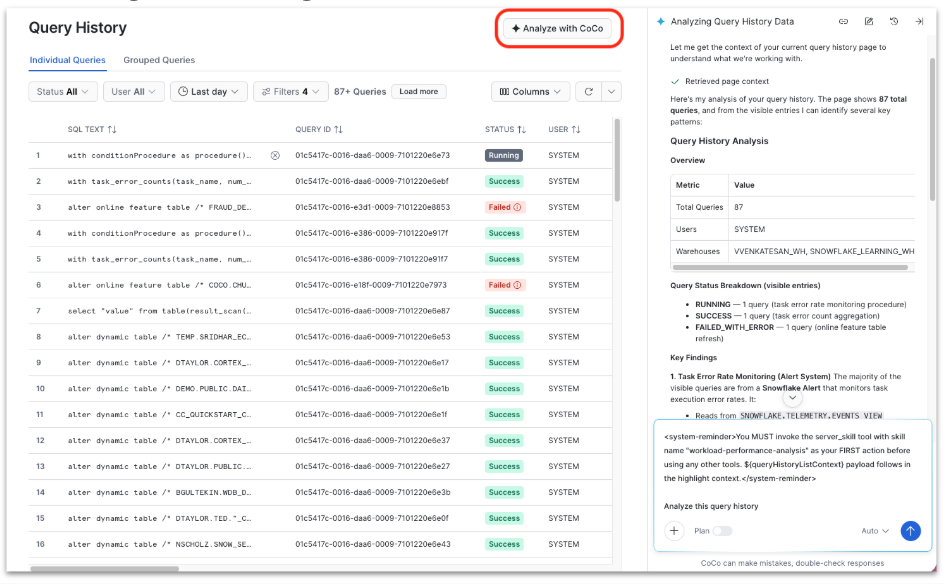
Query History
From Query History, select Analyze with CoCo when you have one or more queries in view. The skill uses the list context from the page to summarize or compare those queries. For more information, see Query history in Snowsight.
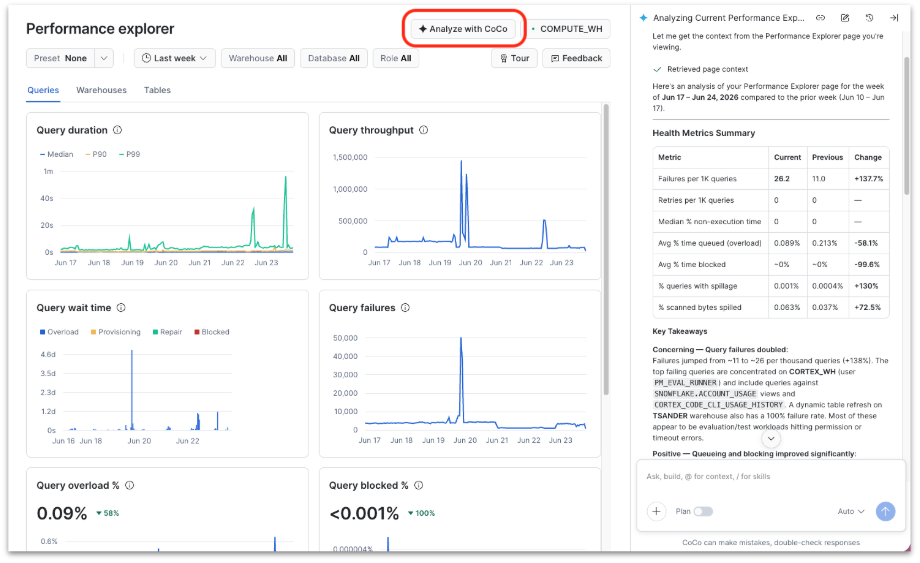
Performance Explorer
From the Performance Explorer dashboard, select Analyze with CoCo to interpret workload trends, hotspots, or changes over time in the context of the charts and filters you already applied. For more information, see Analyzing query workloads with Performance Explorer.
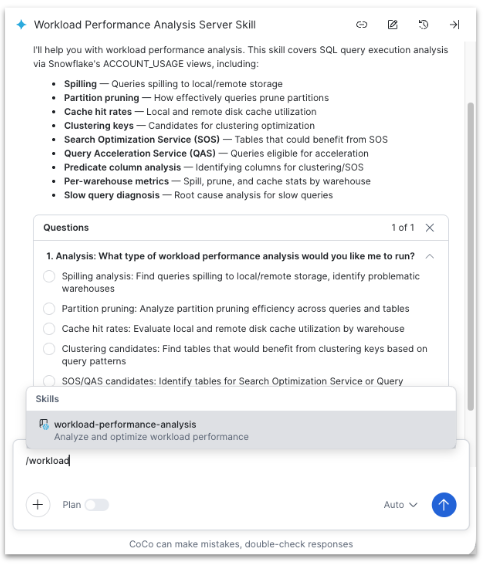
Cortex Code (CLI, Desktop, Snowsight panel)
Open Cortex Code directly and describe what to analyze, or type /workload-performance-analysis to invoke the skill.
This path also applies when you open the Cortex Code panel in Snowsight without using a page-specific Analyze
action. For more information, see
Cortex Code CLI bundled skills.
Snowsight entry points pass page context so you don’t need to copy query IDs or re-enter filters. In CLI, Desktop, or the general Snowsight panel, include the scope in your prompt (warehouse name, query ID, table name, time range, and so on).
Example ways to use the skill
These outcomes match common workloads the skill is designed for:
- Identify queries with excessive disk spilling and get concrete fix recommendations.
- Analyze partition pruning ratios and suggest better clustering keys for large tables.
- Find queries eligible for Search Optimization Service or Query Acceleration Service.
Example prompts:
In Cortex Code CLI, you can also run /workload-performance-analysis
and then describe your question.
Prerequisites and access
You need:
-
Access to Cortex Code in your account. See Cortex Code in Snowsight and Cortex Code CLI.
-
Privileges to read the ACCOUNT_USAGE views the skill queries. Many analyses require the
SNOWFLAKE.USAGE_VIEWERdatabase role (or related usage or governance roles for specific views). An administrator can grant access, for example:
What you can see matches the query and account activity your roles can access in Snowsight and ACCOUNT_USAGE.
Limitations
Keep these constraints in mind:
- Historical data only: The skill analyzes past runs in ACCOUNT_USAGE; it does not predict future performance.
- Latency: ACCOUNT_USAGE data can lag behind real time (for example, up to about 45 minutes for query history and longer for some pruning views).
- Hybrid tables: Visibility in these views can be limited for hybrid tables.
- Benefit estimates: The skill can flag SOS or clustering candidates but can’t guarantee exact savings from enabling them.
When recommending warehouse sizing or queuing tradeoffs, the skill may ask whether your workload prioritizes speed
(minimize wait time and runtime) or cost (accept some queuing or spilling to save credits). That framing helps
tailor guidance; for credit and spend analysis, use the
cost-intelligence skill instead.
Related performance resources
- Using query insights to improve performance: Rule-based insights on individual queries in Snowsight.
- Analyzing query workloads with Performance Explorer: Interactive workload dashboards in Snowsight.
- Optimizing query performance: Manual tuning strategies and reference material.
- Cortex Code CLI bundled skills: Bundled skill reference entry.