Using the Query Acceleration Service (QAS)
The query acceleration service (QAS) can accelerate parts of the query workload in a warehouse. When it is enabled for a warehouse, it can improve overall warehouse performance by reducing the impact of outlier queries, which are queries that use more resources than the typical query. The query acceleration service does this by offloading portions of the query processing work to shared compute resources that are provided by the service.
At a high-level, QAS accelerates two categories of query patterns:
- Queries with large scans and selective filters.
- Queries that insert, copy, update, or delete large amounts of data.
The query acceleration service can handle these types of workloads more efficiently by performing more work in parallel and reducing the wall-clock time spent in scanning and filtering.
Note
The query acceleration service depends on server availability. Therefore, performance improvements might fluctuate over time.
Enabling query acceleration
To enable the query acceleration service, specify the clause ENABLE_QUERY_ACCELERATION = TRUE with the CREATE WAREHOUSE or ALTER WAREHOUSE command.
The Query Acceleration Service is also enabled by default in Snowflake Gen2 standard warehouses and multi-cluster warehouses.
Examples
The following example explicitly enables the query acceleration service for a new warehouse named my_wh.
For a single-cluster Gen1 warehouse named my_other_wh, the example creates the warehouse with QAS disabled and then
enables it with ALTER WAREHOUSE:
Run the SHOW WAREHOUSES command to display details about the my_wh warehouse.
The following query uses the pipe operator (->>) to return information about
just the columns from the SHOW output that are relevant for QAS processing:
Note
The scale factor is 8 when you explicitly set ENABLE_QUERY_ACCELERATION = TRUE in CREATE WAREHOUSE. When Snowflake
automatically enables QAS for Gen2 or multi-cluster warehouses at
creation time, the default scale factor is 2.
The query acceleration service might increase the credit consumption rate of a warehouse. The maximum scale factor can help limit the consumption rate. See Adjusting the scale factor to learn how to specify the QUERY_ACCELERATION_MAX_SCALE_FACTOR property. You do so using the CREATE WAREHOUSE and ALTER WAREHOUSE commands.
The QUERY_ACCELERATION_ELIGIBLE view and the SYSTEM$ESTIMATE_QUERY_ACCELERATION function might be useful in determining an appropriate scale factor for a warehouse. See Identifying queries and warehouses that might benefit from query acceleration (in this topic) for details.
Identifying queries and warehouses that might benefit from query acceleration
To identify the queries or warehouses that might benefit from the query acceleration service, you can query the QUERY_ACCELERATION_ELIGIBLE view. You can also use the SYSTEM$ESTIMATE_QUERY_ACCELERATION function to assess whether a specific query is eligible for acceleration.
Eligible queries
In general, queries are eligible because they have a portion of the query plan that can be run in parallel using QAS compute resources. These queries fall into one of two patterns:
- Large scans with an aggregation or selective filter.
- Large scans that insert or copy many new rows (for example, INSERT and COPY commands).
Snowflake doesn’t have a specific cutoff for what constitutes a “large enough” scan to be eligible. The threshold for eligibility depends on a variety of factors, including the query plan and warehouse size. Snowflake only marks a query as eligible if there is high confidence that the query would be accelerated if QAS was enabled. Over time, Snowflake is expanding the query patterns that are eligible for acceleration. For example, formerly QAS didn’t accelerate queries with a LIMIT clause and no ORDER BY clause, but now Snowflake automatically determines whether such queries can benefit from QAS.
Common reasons that queries are ineligible
Some queries are ineligible for query acceleration. The following are common reasons why a query cannot be accelerated:
- There aren’t enough partitions in the scan. If there aren’t enough partitions to scan, the benefits of query acceleration are offset by the latency in acquiring resources for the query acceleration service.
- Even if a query has a filter, the filters might not be selective enough. Alternatively, if the query has an aggregation with GROUP BY, the cardinality of the GROUP BY expression might be too high for eligibility.
- The query includes a LIMIT clause that prevents acceleration. QAS automatically determines which queries with LIMIT clauses (including those without ORDER BY) can be accelerated.
- The query includes functions that return nondeterministic results (for example, SEQ or RANDOM).
Identifying queries with the SYSTEM$ESTIMATE_
The SYSTEM$ESTIMATE_QUERY_ACCELERATION function can help determine if a previously executed query might benefit from the query acceleration service. If the query is eligible for query acceleration, the function returns the estimated query execution time for different query acceleration scale factors.
Example
Execute the following statement to help determine if query acceleration might benefit a specific query:
In this example, the query is eligible for the query acceleration service. The result value includes estimated
query times using the service. The ineligibleReason property is empty.
The following example shows the results for a query that is not eligible for query acceleration service:
The statement above produces the following output. The estimated query times are blank.
The ineligibleReason property reports why the query didn’t use QAS.
Identifying queries and warehouses with the QUERY_
Query the QUERY_ACCELERATION_ELIGIBLE view to identify the queries and warehouses that might benefit the most from the query acceleration service. For each query, the view includes the amount of query execution time that is eligible for the query acceleration service.
Examples
Note
These examples assume the ACCOUNTADMIN role (or a role granted IMPORTED PRIVILEGES on the shared SNOWFLAKE database) is in use. If it is not in use, execute the following command before running the queries in the examples:
Identify the queries in the past week that might benefit the most from the service by the longest amount of query execution time that is eligible for acceleration:
Identify the queries in the past week that might benefit the most from the service in a specific warehouse mywh:
Identify the warehouses with the most queries, in the past week, eligible for the query acceleration service:
Identify the warehouses with the most eligible time for the query acceleration service in the past week:
Identify the upper limit scale factor in the past week for the query acceleration
service for warehouse mywh:
Identify the distribution of scale factors in the past week for the query acceleration service for warehouse mywh:
Adjusting the scale factor
The scale factor is a cost control mechanism that allows you to set an upper bound on the amount of compute resources a warehouse can lease for query acceleration. This value is used as a multiplier based on warehouse size and cost.
For example, suppose that you set the scale factor to 5 for a medium warehouse. This means that:
- The warehouse can lease compute resources up to 5 times the size of a medium warehouse.
- Because a medium warehouse costs 4 credits per hour, leasing these resources can cost up to an additional 20 credits per hour (4 credits per warehouse x 5 times its size).
Tip
The scale factor applies to the entire warehouse, whether it’s a single-cluster or multi-cluster warehouse. If you use QAS for a multi-cluster warehouse, consider increasing the scale factor. That way, all the warehouse clusters can take advantage of the QAS optimizations.
The cost is the same no matter how many queries are using the query acceleration service at the same time. The query acceleration service is billed by the second, only when the service is in use. These credits are billed separately from warehouse usage.
Not all queries require the full set of resources that are made available by the scale factor. The amount of resources requested for the service depends on how much of the query is eligible for acceleration and how much data will be processed to answer it. Regardless of the scale factor value or the amount of resources requested, the amount of available compute resources for query acceleration is bound by the availability of resources in the service and the number of other concurrent requests. The query acceleration service only uses as many resources as it needs and that are available at the time the query is executed.
If the scale factor is not explicitly set, the default value is 8, unless QAS is implicitly enabled as part of a Gen2 warehouse, in which case the default is 2. Setting the scale factor to 0 eliminates the upper bound limit
and allows queries to lease as many resources as necessary and as available to service the query.
Example
The following example modifies the warehouse named my_wh to enable the query acceleration service with a maximum
scale factor of 0.
Monitoring query acceleration service usage
This section describes how to monitor the usage of the query acceleration service. By monitoring, you can understand the performance impact, identify which queries benefit most from acceleration, and assess the overall effectiveness of the feature. Doing so can help you manage your costs and optimize your workloads.
Using the web interface to monitor query acceleration usage
Once you enable the query acceleration service, you can view the Profile Overview panel in the Query Profile tab to see the effects of the query acceleration results.
The following screenshot displays an example of the statistics displayed for the query overall. If multiple operations in a query were accelerated, the results are aggregated in this view so you can see the total amount of work done by the query acceleration service.
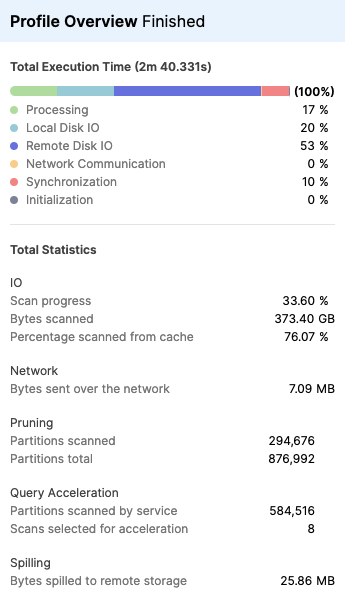
The Query Acceleration section of the Profile Overview panel includes the following statistics:
- Partitions scanned by service — number of files offloaded for scanning to the query acceleration service.
- Scans selected for acceleration — number of table scans being accelerated.
In the operator details (see Statistics), click on the operator to see detailed information. The following screenshot displays an example of the statistics displayed for a TableScan operation:
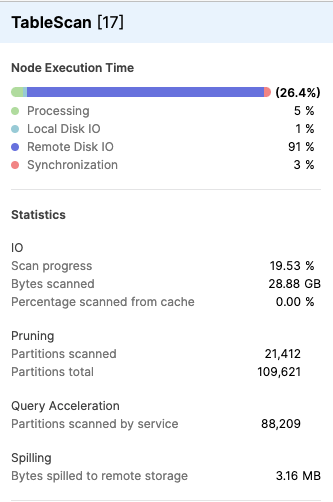
The Query Acceleration section of the TableScan details panel includes the following statistics:
- Partitions scanned by service — number of files offloaded for scanning to the query acceleration service.
Using the Account Usage QUERY_
To see the effects of query acceleration on a query, you can use the following columns in the QUERY_HISTORY view.
- QUERY_ACCELERATION_BYTES_SCANNED
- QUERY_ACCELERATION_PARTITIONS_SCANNED
- QUERY_ACCELERATION_UPPER_LIMIT_SCALE_FACTOR
You can use these columns to identify the queries that benefited from the query acceleration service. For each query, you can also determine the total number of partitions and bytes scanned by the query acceleration service.
For descriptions of each of these columns, see QUERY_HISTORY view.
Note
For a given query, the sum of the QUERY_ACCELERATION_BYTES_SCANNED and BYTES_SCANNED columns might be greater when the query acceleration service is used than when the service is not used. The same is true for the sum of the columns QUERY_ACCELERATION_PARTITIONS_SCANNED and PARTITIONS_SCANNED.
The increase in the number of bytes and partitions is due to the intermediary results that are generated by the service to facilitate query acceleration.
For example, to find the queries with the most bytes scanned by the query acceleration service in the past 24 hours:
To find the queries with the largest number of partitions scanned by the query acceleration service in the past 24 hours:
Query acceleration service cost
Query Acceleration consumes credits as it uses serverless compute resources to execute portions of eligible queries.
Query Acceleration is billed like other serverless features in Snowflake in that you pay by the second for the compute resources used. To learn how many credits per compute-hour are consumed by the Query Acceleration Service, refer to the “Serverless Feature Credit Table” in the Snowflake Service Consumption Table.
Viewing billing information in Snowsight
If you have Query Acceleration enabled for your account, use the Cost Management page in Snowsight to view billing information for the Query Acceleration Service.
To see Query Acceleration Service spending, complete the following steps:
-
Sign in to Snowsight.
-
In the navigation menu, select Admin » Cost management.
-
Select the Consumption tab.
-
Select Query Acceleration from the Service Type drop-down.
Snowsight displays the Query Acceleration Service spending for your account.
Viewing billing using the Account Usage QUERY_
You can view billing data in the Account Usage QUERY_ACCELERATION_HISTORY view.
Example
This query returns the total number of credits used by each warehouse in your account for the query acceleration service (month-to-date):
Viewing billing using the Organization Usage QUERY_
You can view billing data for the query acceleration service for all accounts in your organization in the Organization Usage QUERY_ACCELERATION_HISTORY view.
Example
This query returns the total number of credits used by each warehouse in each account for the query acceleration service (month-to-date):
Viewing billing using the QUERY_
You can also view billing data using the Information Schema QUERY_ACCELERATION_HISTORY function.
Example
The following example uses the QUERY_ACCELERATION_HISTORY function to return information about the queries accelerated by this service within the past 12 hours:
Evaluating cost and performance
This section includes example queries that might help you evaluate query performance and cost before and after enabling the query acceleration service.
Viewing warehouse and query acceleration service costs
The following query computes the costs of the warehouse and the query acceleration service for a specific warehouse. You can execute this query after enabling the query acceleration service for a warehouse to compare costs before and after enabling query acceleration. The date range for the query begins 8 weeks prior to the first credit usage for the query acceleration service to 8 weeks after the last incurred cost for query acceleration service (or up to the current date).
Note
- This query is most useful for evaluating the cost of the service if the warehouse properties and workload remain the same before and after enabling the query acceleration service.
- This query returns results only if there has been credit usage for accelerated queries in the warehouse.
This example query returns the warehouse and query acceleration service costs for my_warehouse:
Viewing query performance
This query returns the average execution time for query acceleration eligible queries for a given warehouse. The date range for the query begins 8 weeks prior to the first credit usage for the query acceleration service to 8 weeks after the last incurred cost for query acceleration service (or up to the current date). The results might help you evaluate how the average query performance changed after enabling the query acceleration service.
Note
- This query is most useful for evaluating query performance if the warehouse workload remains the same before and after enabling the query acceleration service.
- If the warehouse workload remains stable, the value in the
num_execscolumn should remain consistent. - If the value in the
num_execscolumn of the query results dramatically increases or decreases, the results of this query will likely not be useful for query performance evaluation.
This example query returns the query execution time by day and computes the 7 day average for the week prior for queries that are
eligible for acceleration in the warehouse my_warehouse:
The output from the statement includes the following columns:
| Column | Description |
|---|---|
| EXEC_DATE | Query execution date. |
| AVG_EXEC_TIME_7DAYS | The average execution time for the prior 7 days inclusive of EXEC_DATE. |
| AVG_EXEC_TIME | The average query execution time. |
| QAS_ACCEL_FLAG | 1 if any queries were accelerated; NULL if no queries were accelerated. |
| NUM_EXECS | Number of queries accelerated. |
| EXEC_TIME | Total execution time of all query acceleration eligible queries. |
Tip
When the query acceleration service (QAS) is enabled, Snowflake writes a small amount of data to remote storage
for each eligible query, even if QAS isn’t used for that query. Therefore, don’t be concerned by a nonzero
value for bytes_spilled_to_remote_storage in the QUERY_HISTORY view when QAS is enabled.
Compatibility with search optimization
Query acceleration and search optimization can work together to optimize query performance. First, search optimization can prune the micro-partitions not needed for a query. Then, for eligible queries, query acceleration can offload portions of the rest of the work to shared compute resources provided by the service.
Performance of queries accelerated by both services varies depending on workload and available resources.