Snowflake Postgres Insights
Snowflake Postgres provides two levels of insights into your instance’s health and performance:
- Basic insights: Point-in-time views of cache hit rates, indexes, bloat, queries, vacuum, table sizes, and connections. These are available on every instance in Snowsight with no setup.
- Expanded insights: Continuous metric collection with hourly and daily history, expected-range
baselines, metric trend forecasts, and additional Snowsight dashboards. Requires the
insightsextension.
Basic insights
Basic insights are available on every Snowflake Postgres instance’s details page in Snowsight, with no setup required. They provide a point-in-time view of your database, along with recommended actions to improve performance.
To view an instance’s insights:
- In the navigation menu, select Postgres.
- Select your instance to open its details page.
- Under the Details tab heading, select an insight from the Insight list.
The available insights are:
- Cache and index hit rates
- Unused indexes
- Bloat
- Outlier queries
- Long running queries
- Vacuum statistics
- Table sizes
- Connections
Cache hit
Postgres keeps frequently accessed data in its shared buffers cache. The cache hit ratio is the percentage of data requests that the buffer cache serves, out of all requests it receives. A cache hit is a request served from the cache. A cache miss is a request that must be read from the file system instead.
For example, 100 cache hits and 2 misses produce a cache hit ratio of 100/102, or 98%.
For typical workloads, the cache hit ratio should be near 99%. A consistently lower ratio can indicate that the working set doesn’t fit in memory. Consider moving to an instance with more memory.
Index hit
Indexes are critical to query and application performance, particularly on large tables.
The index hit rate is the percentage of table scans that use an index, out of all scans of the table. A higher index hit rate indicates better index utilization and query performance.
For tables larger than 10,000 rows, the index hit rate should be 99% or higher. A table of that size with low or no index usage is a good candidate for a new index.
Unused indexes
Unused indexes are indexes that exist on a table but aren’t used by queries. They consume disk space, require maintenance, and can degrade performance in the following ways:
- Storage: Unused indexes occupy disk space, which increases storage costs.
- Write overhead: Every insert, update, and delete must also update each index on the table, so unused indexes slow down data modification.
- Query planning: The query planner evaluates all available indexes when it builds an execution plan. Unused indexes add planning time.
- Maintenance: Vacuum and other maintenance operations consume CPU and disk I/O on every index, including unused ones.
Important
An index that’s unused on a primary instance might still be used on a replica. Check replica usage before you drop an index.
Bloat
Bloat is the accumulation of dead rows in tables and indexes. It increases disk usage and can degrade performance, particularly for workloads with a high rate of updates and deletes.
Postgres uses multiversion concurrency control (MVCC) to handle concurrent transactions. When a row is updated or deleted, Postgres creates a new row version and marks the old version as dead. Dead rows aren’t removed immediately, so concurrent transactions can still see a consistent view of the data. Vacuum later removes dead rows and makes the space available for reuse. Bloat occurs when dead rows accumulate faster than vacuum removes them.
The bloat percentage is the estimated share of a table’s or index’s size that’s taken up by dead
rows. For a more precise measurement, use the
pgstattuple extension. Note that
pgstattuple can be resource-intensive on large tables.
- Low bloat (below 50%): Generally acceptable and doesn’t require action. Continue to monitor bloat and review vacuum settings.
- High bloat (50% or higher): Can significantly affect performance and disk usage. If you notice slow queries, consider running a manual vacuum or adjusting vacuum settings.
Bloat isn’t displayed for tables smaller than 1 GB or for tables with less than 10% bloat.
Outlier queries
The outlier queries insight lists the queries with the highest share of total execution time. These can be slow, infrequent queries or moderately slow queries that run very often. These queries are the best starting point for query tuning and indexing.
Long running queries
Long-running queries can affect your database and applications in the following ways:
- Resource usage: They hold CPU, memory, and disk I/O for an extended period.
- Contention: They can hold locks that block other queries.
- Throughput: They reduce the number of queries the instance can complete in a given time.
- Application latency: Applications that depend on these queries can become slow or unresponsive.
- Resource exhaustion: They can consume excessive memory, which can lead to out-of-memory errors, and can generate large temporary files that consume disk space.
Vacuum
The vacuum insight shows vacuum statistics for each table:
- Table name
- Last vacuum: The last time a manual vacuum ran on the table.
- Last autovacuum: The last time autovacuum ran on the table.
- Row count: The total number of rows in the table.
- Dead row count: The current number of dead rows in the table.
- Scale factor: The autovacuum scale factor for the table.
- Threshold: The number of dead rows, based on the scale factor, that triggers autovacuum.
- Should vacuum: Whether a manual vacuum is recommended for the table.
Table sizes
The table sizes insight shows the following information for each table:
- Table name
- Approximate row count
- Total table size
- Size of the table’s indexes
- Size of the table’s TOAST data
- Size of the table’s row data
Connections
The connections insight lists all active and idle connections to the instance. An active connection is running a query or waiting to run one. An idle connection is open but not running a query.
Idle connections are normal, but a large number of them consumes memory. A consistently high number of idle connections usually indicates that the workload would benefit from connection pooling.
Each connection has a process ID (PID) that uniquely identifies its backend process.
To cancel a connection’s current query while leaving the session open, run:
To close the connection and roll back any open transaction, run:
Expanded insights
The insights extension continuously collects performance and health metrics
from your Postgres instance and stores them inside the database. It samples standard
Postgres statistics views and displays this as hourly and daily summaries, expected-range baselines, and metric trend forecasts in Snowsight.
The data is stored in standard tables in the insights schema, so you can also query it directly
with SQL. No external agent, collector, or time-series database is required. You can use the data
for custom dashboards (for example, Grafana), custom applications, troubleshooting, and planning for
database growth.
Note
Expanded insights require Postgres 18.6 or later. If the insights extension isn’t available on
your instance, refresh the instance
to pick up the latest Postgres version and features.
What expanded insights collect
| Category | Examples |
|---|---|
| Cluster-wide activity | background writer, checkpointer, WAL, archiver |
| Database activity | commits, rollbacks, blocks read/hit, tuples, temp files, deadlocks |
| Connections and sessions | active/idle counts, longest query, longest transaction, lock waits |
| Relations | table and index size, scans, I/O, dead tuples, vacuum activity |
| Replication | sender/receiver state, replication slots, subscriptions |
| SQL statement statistics | per-query calls, timing, rows, buffers (via pg_stat_statements) |
| Configuration | non-default server settings and version information |
| Operating system | CPU, memory, load average, disk, network |
How expanded insights work
Background workers run the following collection pipeline automatically. You don’t need to call these steps manually. The diagram shows how data flows between the tables.
- Collections are the named units of work (for example
pg_session). Each one is due on its own interval. - Metrics are the individual values a collection emits (for example
active,idle). Multi-valued metrics carry a JSON key (for example{"datname": "mydb"}). - Properties are slowly-changing settings (for example server configuration) tracked separately, with a history of changes.
Enable expanded insights
Prerequisites
- Postgres 18.6 or later. If
insightsdoesn’t appear inpg_available_extensions, see Extension not available on the instance. - The
pg_stat_statementsextension. Theinsightsextension depends on it for SQL statement statistics.
Create the extension
Connect to the database you want to monitor, then create the extension. The CASCADE option
also creates the pg_stat_statements extension if it doesn’t already exist in the database:
All objects are created in the insights schema. The background workers begin collecting on
their schedule immediately. No further action is required.
Verify the installation
You can also confirm that data is landing:
Triage database health with expanded insights
After you enable the extension, use the following steps to triage database health issues:
-
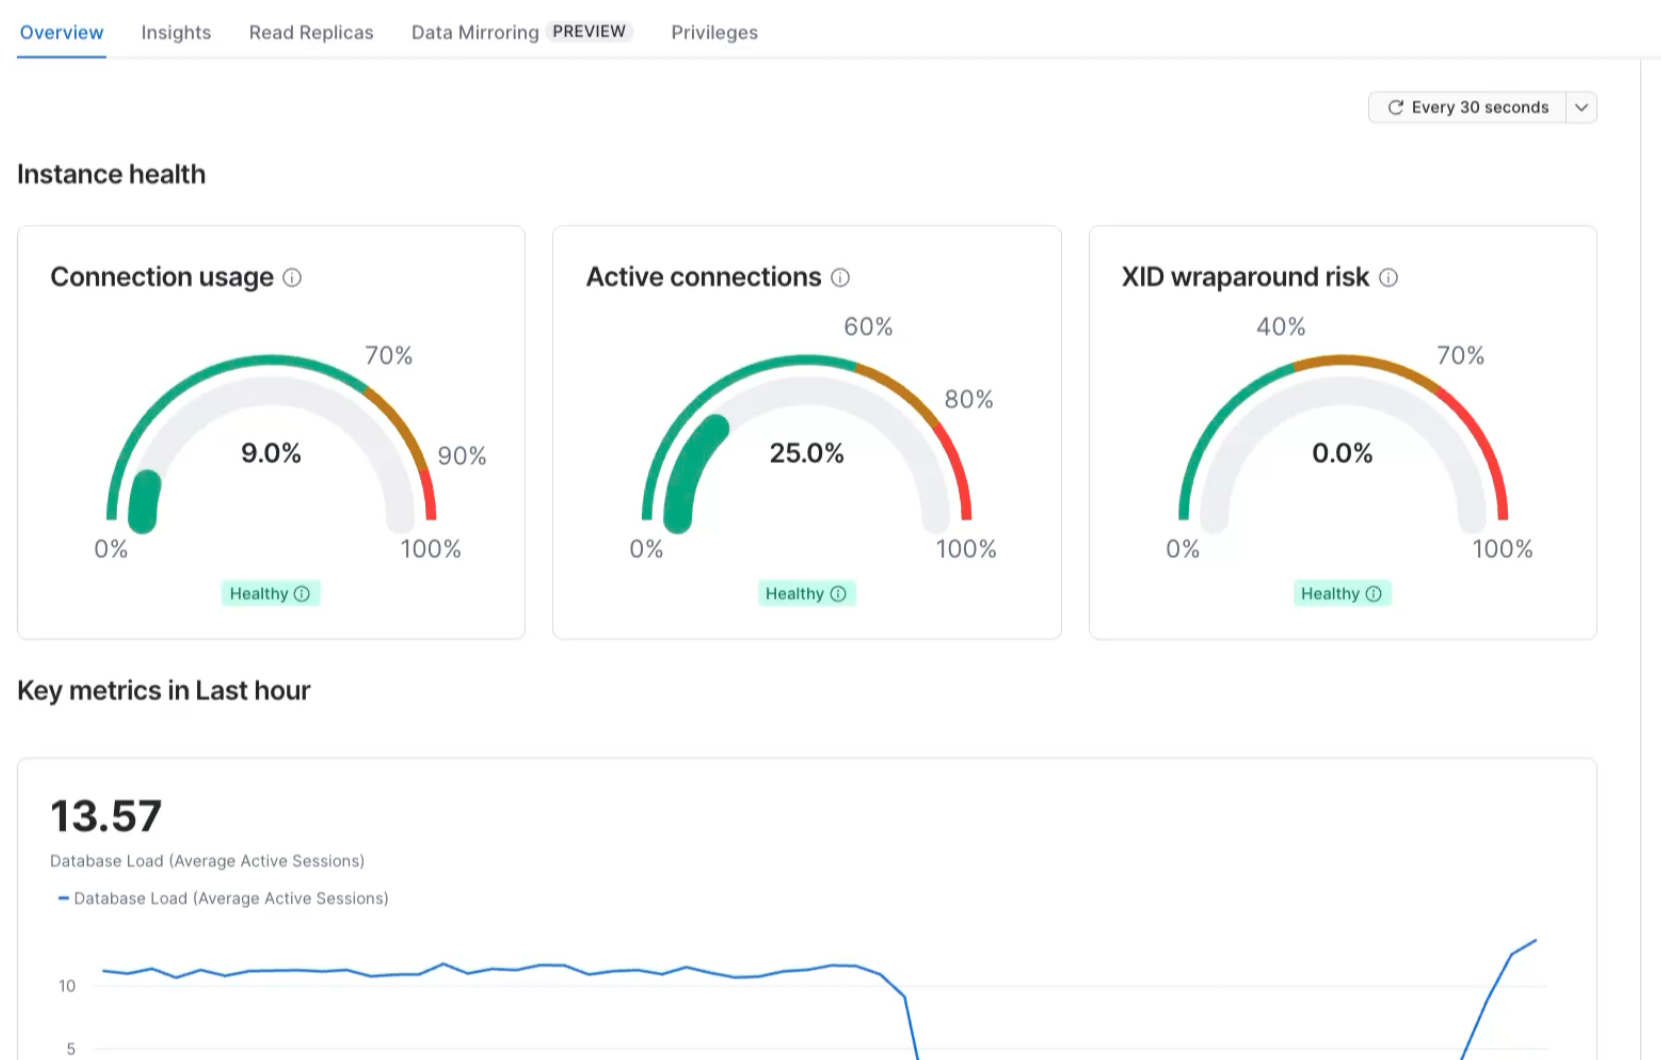
See the metric: In Snowsight, open your instance’s details page and select the Overview tab. It shows three health gauges (connection usage, active connections, XID wraparound risk) and four key metric charts. Green is healthy, amber means investigate, red means act now.
-
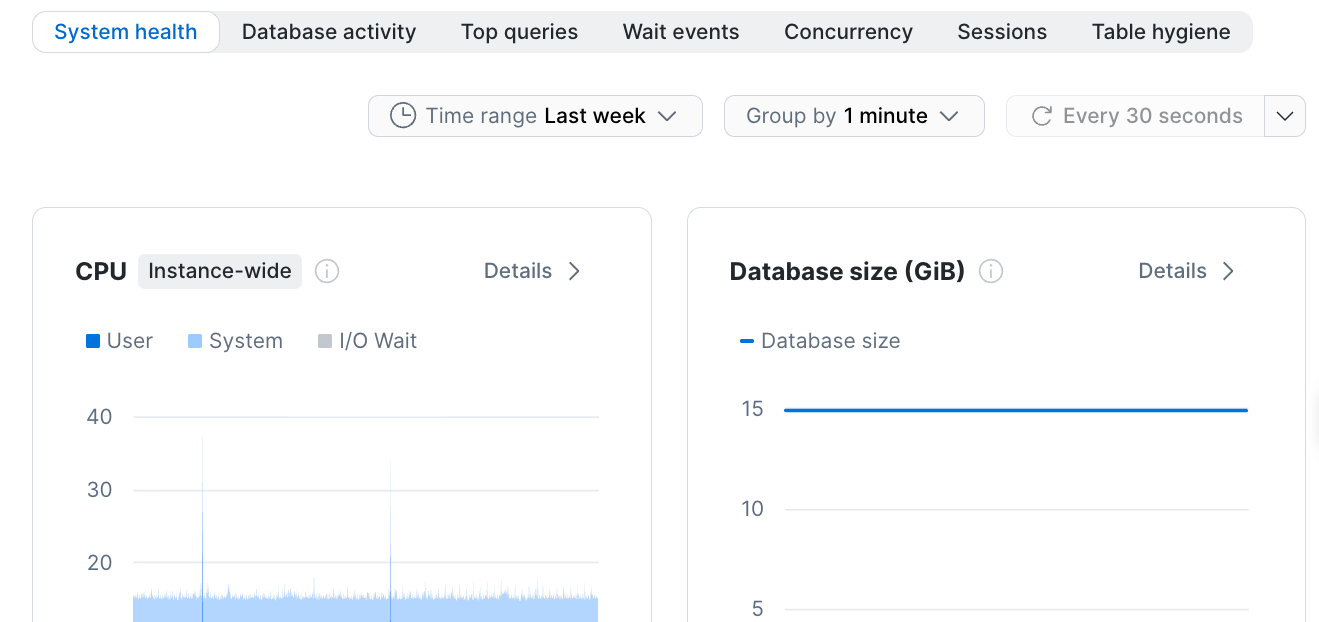
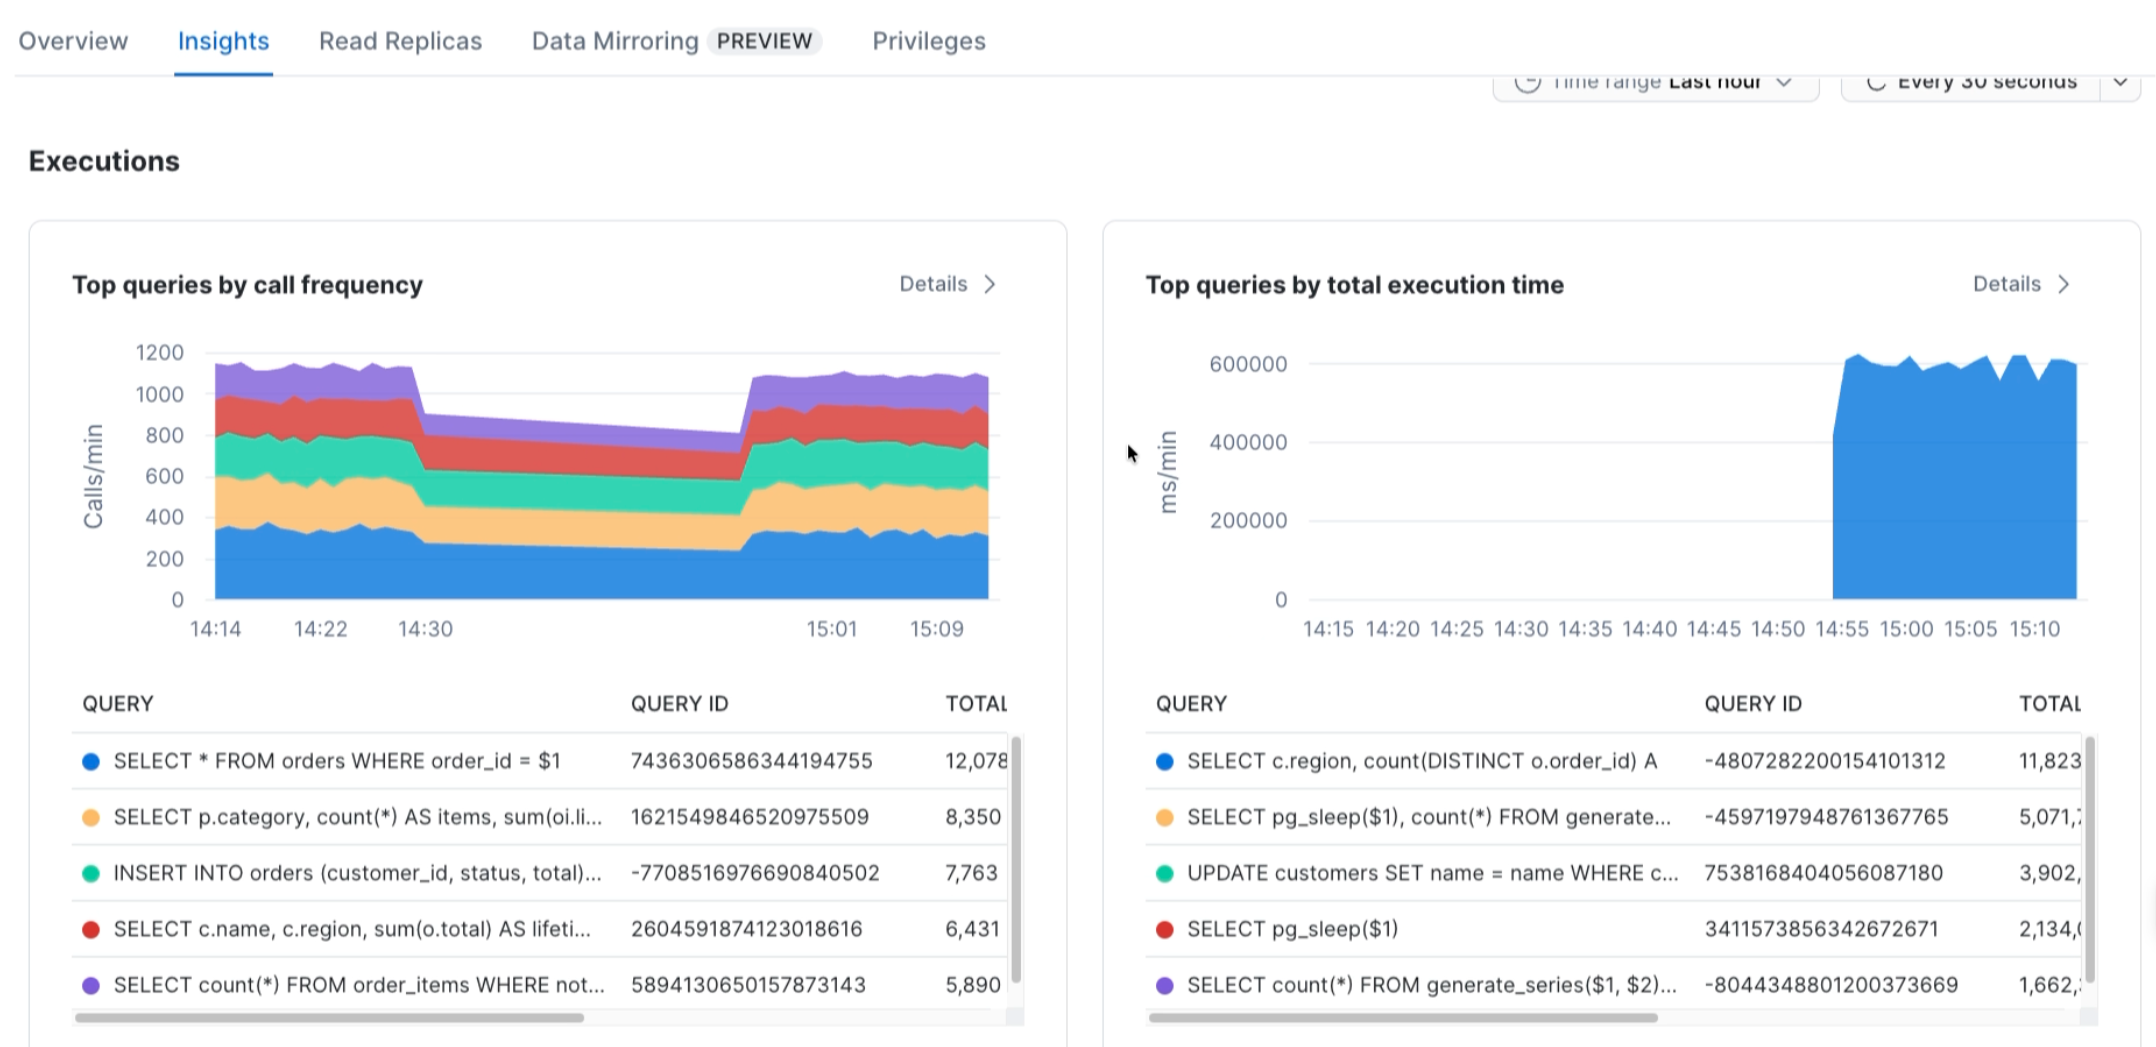
Interpret the cause: Select the Insights tab and drill into the relevant sub-tab. If connections are high, check the Sessions tab. If the database is slow, check Top queries and Wait events. If vacuum is falling behind, check Table hygiene. Each tab provides the detail you need to identify the specific query, session, lock, or table behind the problem.
-
Take action: Fix the root cause: tune the query, kill the blocking session, add an index, run vacuum, enable connection pooling, or resize the instance.
Query expanded insights data
Current connection state
Connection count over the last hour
Peak and average connections by hour (last 7 days)
Active session wait events (last 5 minutes)
Top 10 queries by total execution time
PostgreSQL configuration changes over time
Metrics currently outside their expected range (anomalies)
pgi_metric_trend records the normal range for each metric at each hour of the week. Join
current values against it to surface anything unusual for the current day-of-week and hour:
Metric trend forecast
pgi_metric_forecast projects each metric’s recent daily trend forward, up to 180 days, using
linear regression. Use it to anticipate when a metric such as active connections or database size
will reach a limit for your instance.
Configure expanded insights
Setting expanded insights server parameters
A few extension settings, such as insights.enabled and the insights.retention_* windows,
are PostgreSQL server parameters. On Snowflake Postgres, you can’t change server
parameters with ALTER SYSTEM, by editing postgresql.conf, or by calling pg_reload_conf().
Instead, set them on the instance in Snowsight or with Snowflake SQL. You can use either the instance settings in Snowsight
or the ALTER POSTGRES INSTANCE command with the POSTGRES_SETTINGS clause, keyed as
component:parameter_name:
None of the insights parameters require an instance restart, so you don’t need to wait for a
maintenance window. APPLY IMMEDIATELY applies the change as soon as it’s ready. For the full
server-settings mechanism and the Snowsight UI steps, see
Snowflake Postgres server settings,
ALTER POSTGRES INSTANCE, and
Managing instances.
Note
Many day-to-day adjustments don’t require a server-parameter change. You can enable or disable
individual collections, change their intervals, and apply a one-off retention purge with
SQL against the insights schema, as described in the following sections.
Managing expanded insights collections
Collection behavior is controlled by the pgi_collection table. Changes take effect on the
background worker’s next scheduling cycle; no restart is needed.
Enable or disable a collection
Change how often a collection runs
Force a collection to run now
pgi_snapshot() runs only the collections whose next_collect time has passed. Reset the
watermark to collect on the next cycle:
Pause all background collection
To stop the background workers without removing the extension, set the insights.enabled
server parameter to off. On Snowflake Postgres, server parameters are changed in
Snowsight or with Snowflake SQL, not with ALTER SYSTEM, postgresql.conf, or
pg_reload_conf(). Using ALTER POSTGRES INSTANCE:
Set it back to "on" the same way to resume. See
Setting expanded insights server parameters for details.
Tip
You don’t need a server-parameter change to pause an individual collection. Update its row in
pgi_collection instead (see Managing expanded insights collections). That takes effect
on the next scheduling cycle and requires only a table UPDATE.
Note
Modifying pgi_collection requires ownership of the table or an explicit UPDATE grant.
Objects are owned by the snowflake_insights role. A privileged user can delegate control:
Data retention
Old rows are removed automatically by a scheduled purge task. Retention windows are server parameters, so you can change the defaults without touching the schema.
| Table | Default | Server parameter |
|---|---|---|
pgi_metric_history | 30 days | insights.retention_raw |
pgi_metric_summary_hour | 180 days | insights.retention_hour |
pgi_metric_summary_day | 360 days | insights.retention_day |
pgi_property_history | 60 days | insights.retention_property |
pgi_wait_event | 1 day | fixed: not configurable |
To change a default, set the corresponding server parameter in Snowsight or with Snowflake SQL (see Setting expanded insights server parameters). For example, to keep raw history for two weeks:
To apply a retention window immediately without changing a server parameter, call the purge procedure directly with explicit intervals. This is a SQL call that any user with access to the schema can run:
Access and privacy
Query privacy
pg_stat_statements normalizes literal values out of most queries, so parameter values don’t
appear in pgi_sql. In addition, the extension doesn’t store administrative and
session-management statements that carry no performance value and could contain secrets,
including CREATE/ALTER/DROP USER/ROLE/GROUP, CREATE SUBSCRIPTION, CREATE SERVER,
CREATE USER MAPPING, SET, RESET, SHOW, DISCARD, DEALLOCATE, and COMMENT.
Caution
The pgi_wait_event samples capture pg_stat_activity.query, which is not normalized.
Literal parameter values can appear there. This data is retained for one day and is readable by
pg_monitor. Consider this before relying on wait-event sampling in regulated environments.
Granting read access to expanded insights
Objects are owned by the snowflake_insights role. To let another user read Insights data:
Uninstalling expanded insights
To also stop the background workers, set the insights.enabled server parameter to off
in Snowsight or with Snowflake SQL (see Setting expanded insights server parameters). Removing
insights from the instance’s preloaded libraries requires a restart and is also a
server-parameter change made in Snowsight or with Snowflake SQL.
Troubleshooting expanded insights
No data is being collected
Confirm collections are enabled and due:
Confirm the background workers are running:
If no insights% workers appear, confirm that insights is preloaded and enabled. These are
instance server parameters, changed in Snowsight or with Snowflake SQL (see
Setting expanded insights server parameters). You can read their current values
with:
SQL statistics are empty
Verify pg_stat_statements is installed, preloaded, and tracking:
Permission denied reading insights tables
Grant read access as shown in Granting read access to expanded insights.
Database size chart appears blank
The pg_db_size collection (exact filesystem walk) is disabled by default because it can be
expensive on large databases. The hourly pg_db_size_est estimate only fires once per hour.
On a fresh instance the Snowsight Database size (GiB) chart might show nothing until the first
estimate runs.
To populate it immediately, either enable the exact collector or force the estimate to run:
The chart should populate within about one minute.
Database load chart shows zero
The Database load chart (average active sessions) is calculated from sampled data at
30-second intervals. If all queries complete in milliseconds, no session will be in the
active state when the sampler fires. This is expected for fast, light workloads and doesn’t
indicate a problem.
Trend and forecast tables are empty
pgi_metric_trend needs several days of history to build hour-of-week expected ranges.
pgi_metric_forecast needs at least a week to compute a meaningful linear regression. Both
tables populate automatically as data accumulates. No manual action is required.
Extension not available on the instance
The insights extension requires Postgres 18.6 or later. If insights doesn’t appear in
pg_available_extensions, the instance may be running an older Postgres image.
Refresh the instance to pick up the
latest image.
Expanded insights reference
Database tables
All extension objects are in the insights schema. The most commonly queried tables are
listed first.
| Table | What it holds |
|---|---|
pgi_metric | Current (latest) value of every metric: one row per metric |
pgi_metric_history | Raw metric snapshots at ~30-second granularity (30-day retention) |
pgi_metric_summary_hour | Hourly rollups: min/avg/max/stddev/total plus topband/bottomband (180-day retention) |
pgi_metric_summary_day | Daily rollups, same statistics (360-day retention) |
pgi_metric_trend | Expected value range (floor_val, avg_val, ceiling_val) for each day-of-week × hour-of-day |
pgi_metric_forecast | Linear-regression projections, up to 180 days out |
pgi_property | Current value of tracked properties (server settings, version) |
pgi_property_history | History of property changes (60-day retention) |
pgi_sql | Query text, keyed by queryid |
pgi_sql_metric_history | Per-statement execution statistics per snapshot |
pgi_sql_summary | Per-role, per-database SQL statistics roll-up |
pgi_wait_event | Per-session wait-event samples (1-day retention) |
pgi_collection | Collection configuration: what to collect, how often, enabled/disabled |
pgi_jobs / pgi_runs | Background worker job definitions and run history |
Common columns in the metric tables:
| Column | Meaning |
|---|---|
col_name | Collection the row came from (for example pg_session) |
metric_name | Individual metric (for example active) |
metric_key | JSON dimension key for multi-valued metrics, or NULL |
metric_value | Value, stored as text: cast with ::numeric when charting |
snapshot_dt / rollup_dt | Timestamp of the sample or rollup bucket |
Collections and metrics
The extension ships with the collections listed in the following tables. Most run every 30 seconds; larger or more expensive collections run less often. Two collections are disabled by default.
Metrics: every 30 seconds
| Collection | Source |
|---|---|
pg_archiver | pg_stat_archiver |
pg_bgwriter | pg_stat_bgwriter |
pg_checkpointer | pg_stat_checkpointer |
pg_db_stats | pg_stat_database |
pg_function | pg_stat_user_functions |
pg_replication | pg_stat_replication |
pg_replication_slots | pg_replication_slots |
pg_session | pg_stat_activity (derived, per database) |
pg_subscription | pg_stat_subscription |
pg_transaction | pg_database (transaction-ID age) |
pg_wait_event | pg_stat_activity (writes to pgi_wait_event) |
pg_wal | pg_stat_wal (derived from pg_stat_io) |
pg_wal_receiver | pg_stat_wal_receiver |
os_cputime, os_disk, os_loadavg, os_memory, os_network, os_process | Linux /proc |
Metrics: other intervals
| Collection | Interval | Source |
|---|---|---|
pg_stat_statements | 1 minute | pg_stat_statements |
pg_db_size_est | 1 hour | pg_class.relpages: estimated database size |
pg_index_io | 1 day | pg_statio_user_indexes |
pg_index_stats | 1 day | pg_stat_user_indexes |
pg_table_io | 1 day | pg_statio_user_tables |
pg_table_stats | 1 day | pg_stat_user_tables |
Metrics: disabled by default
| Collection | Interval | Why off |
|---|---|---|
pg_db_size | 1 day | pg_database_size() walks the filesystem; expensive on large clusters. The hourly pg_db_size_est covers most needs. |
pg_stat_io | 5 minutes | The source view is rarely enabled and the collection adds many rows per cycle. |
Properties: every day
| Collection | Source |
|---|---|
pg_info | version() |
pg_settings | pg_settings (non-default values only) |
Example: pg_session metrics
Each collection emits a defined set of metrics. For example, pg_session is keyed by
{"datname": …} and emits these gauges:
| Metric | Meaning |
|---|---|
total | Backends attached to the database |
active | Backends running a query |
idle | Idle backends |
idle_in_txn | Backends idle inside a transaction |
max_query_time | Longest currently-running client query (seconds) |
max_txn_time | Longest currently-open client transaction (seconds) |
max_idle_in_txn_time | Longest idle-in-transaction time (seconds) |
max_blocked_query_time | Longest time a query has waited on a lock (seconds) |
pct_connections | Backends as a percentage of max_connections |
pct_active | Non-idle backends as a percentage of total |
Tip
For the full list of metrics emitted by every collection, including units and version differences, query the collection directly to see its live output:
Server parameter reference
Every parameter the extension registers is prefixed with insights.. Time-based values are stored
in seconds. When setting one, use a plain number of seconds or a Postgres duration abbreviation
(s, min, h, or d; for example 14d, not 14 days).
| Parameter | Type | Default | Minimum | What it controls |
|---|---|---|---|---|
insights.enabled | boolean | on | None | Enables the background worker orchestrator that drives all automatic collection. Setting this to off stops every scheduled collection and maintenance task without dropping the extension. |
insights.job_timeout | integer (seconds) | 0 (no limit) | 0 | Maximum execution time for a single scheduled job. A job still running past this limit is cancelled. 0 disables the limit. |
insights.retention_raw | integer (seconds) | 30d | 3d | How long rows are kept in pgi_metric_history before the purge task deletes them. |
insights.retention_hour | integer (seconds) | 180d | 1d | How long rows are kept in pgi_metric_summary_hour. |
insights.retention_day | integer (seconds) | 360d | 1d | How long rows are kept in pgi_metric_summary_day. |
insights.retention_property | integer (seconds) | 60d | 1d | How long rows are kept in pgi_property_history. |
insights.retention_runs | integer (seconds) | 1d | 1h | How long successful job run records are kept in pgi_runs. Failed runs are retained regardless, for troubleshooting. |
Tip
pgi_wait_event has a fixed 1-day retention that isn’t configurable through a parameter.