Snowflake Notebooks 에서 코드 개발 및 실행
이 항목에서는 Snowflake Notebooks 에서 SQL, Python 및 Markdown 코드를 작성하고 실행하는 방법에 대해 설명합니다.
노트북 셀 기본 사항
이 섹션에서는 몇 가지 기본적인 셀 작업을 소개합니다. 노트북을 만들 때 세 개의 예제 셀이 표시됩니다. 해당 셀을 수정하거나 새로운 셀을 추가할 수 있습니다.
새 셀 만들기
Snowflake Notebooks 는 SQL, Python, Markdown의 세 가지 셀을 지원합니다. 새로운 셀을 만들려면 기존 셀 위에 마우스를 올려놓거나 노트북 맨 아래로 스크롤한 다음, 추가할 셀 유형에 대한 버튼 중 하나를 선택하면 됩니다.
다음 방법 중 하나를 사용하여 기존 셀의 언어를 변경합니다.
언어 드롭다운 메뉴를 선택한 후 다른 언어를 선택합니다.

키보드 단축키 를 사용합니다.
셀 편집
편집 충돌을 방지하기 위해 한 번에 한 사용자만 셀을 편집할 수 있습니다. 다른 사용자가 활동 중인 셀을 수정하려고 시도하면 알림이 표시됩니다. 셀은 60초 동안 사용하지 않으면 편집할 수 있게 됩니다.
셀 이동
셀을 마우스로 끌어서 놓거나 작업 메뉴를 사용하여 셀을 이동할 수 있습니다.
참고
셀 간에 초점을 이동하려면 위로 및 아래로 화살표를 사용합니다.
셀 삭제
셀을 삭제하려면 노트북에서 다음 단계를 완료합니다.
키보드 단축키 를 사용하여 셀을 삭제할 수도 있습니다.
Python 및 SQL 셀 사용 시 고려 사항은 노트북 실행을 위한 고려 사항 섹션을 참조하십시오.
Snowflake Notebooks 에서 셀 실행
Python 및 SQL 셀을 Snowflake Notebooks 에서 실행하려면 다음을 수행합니다.
단일 셀 실행: 코드를 자주 업데이트하는 경우 이 옵션을 선택합니다.
노트북의 모든 셀을 순차적인 순서로 실행: 노트북을 제공하거나 공유하기 전에 이 옵션을 선택하면 수신자에게 가장 최신 정보가 표시되도록 할 수 있습니다. 이 옵션은 노트북의 모든 SQL 및 Python 코드 셀을 위에서 아래로 실행합니다. 셀에서 오류가 발생하면 실행이 중지되고 후속 셀이 실행되지 않습니다. 이 동작은 예약된 노트북에도 적용됩니다. 예를 들어, 셀이 10개인 노트북을 실행 중이고 2번 셀에 SQL 구문 오류가 있는 경우, 노트북은 2번 셀 이후부터 실행이 중지됩니다.
Mac 키보드의 경우 CMD + Shift + Return 을 누르거나 Windows 키보드의 경우 CTRL + Shift + Enter 를 누릅니다.
Run all 를 선택합니다.
셀을 실행하고 다음 셀로 이동: 이 옵션을 선택하면 셀을 실행하고 다음 셀로 더 빠르게 이동할 수 있습니다.
위의 모든 항목 실행: 이전 셀의 결과를 참조하는 셀을 실행할 때 이 옵션을 선택합니다.
아래의 모든 항목 실행: 이후 셀이 종속된 셀을 실행할 때 이 옵션을 선택합니다. 이 옵션은 현재 셀과 그 이후의 모든 셀을 실행합니다.
하나의 셀이 실행 중일 때 다른 실행 요청은 큐에 추가되고, 실제로 실행 중인 셀이 완료되면 실행됩니다.
셀 축소 및 확장
노트북 상단의 셀 표시 옵션 중 하나를 선택해 노트북의 표시 범위를 제어할 수 있습니다.
Show/hide all 을 선택하고 적절한 옵션을 선택합니다.
모두 표시: 각 셀의 코드와 결과를 모두 표시합니다.
코드만 표시: 결과를 숨기고 코드 셀만 표시합니다.
결과만 표시: 코드를 숨기고 출력만 표시합니다.
모두 숨기기: 모든 셀의 코드와 결과를 모두 축소합니다.
이러한 옵션은 다음과 같은 경우에 유용합니다.
코드를 읽거나 결과를 검토하는 데 집중하고 싶습니다.
노트북을 프레젠테이션하거나 공유하고 있습니다.
Large 노트북을 보다 효율적으로 탐색해야 합니다.
중복 셀
셀을 복제하면 다음과 같은 경우에 도움이 될 수 있습니다.
쿼리 또는 함수의 변형을 테스트합니다.
작업 버전을 덮어쓰지 않고 디버깅하기.
서로 다른 출력을 나란히 비교합니다.
원본을 잃지 않고 코드를 재사용하거나 기존 셀을 수정할 수 있습니다.
노트북 셀을 복제하려면:
셀 미니맵
셀 미니맵은 노트북의 오른쪽 사이드바에 표시되며, 노트북의 모든 셀을 드래그할 수 있는 간결한 목록을 제공합니다. 미니맵의 각 항목은 코드 또는 텍스트 셀에 해당하며 셀이 표시되는 순서를 반영합니다.
현재 셀: 선택한 셀이 미니맵에서 강조 표시됩니다.
재정렬: 미니맵에서 항목을 끌어다 놓아 노트북의 셀 순서를 빠르게 변경하십시오.
탐색: 미니맵에서 셀 이름을 클릭하면 해당 셀로 바로 이동합니다.
이 기능은 큰 노트북을 탐색하고 내용을 보다 효율적으로 재구성하는 데 유용합니다.
매개 변수로 노트북 실행
EXECUTE NOTEBOOK 명령을 사용하여 노트북을 실행할 때 노트북에 인자를 전달할 수 있습니다. 노트북의 Python 셀에서 명령줄 인자를 보유하는 기본 제공 Python 목록인 sys.argv 변수를 사용하여 이러한 인자에 액세스할 수 있습니다.
노트북에 인자를 전달하면 노트북 동작을 사용자 지정할 수 있습니다. 다음을 할 수 있습니다.
노트북 실행을 개인 설정하거나 사용자 지정합니다.
여러 입력에 동일한 노트북을 재사용합니다.
자동화 또는 작업 예약을 지원합니다.
예
노트북의 Python 셀에서 sys.argv 변수를 사용하여 인자에 액세스할 수 있습니다.
노트북에 전달된 모든 인자 보기
노트북에 전달된 인자의 전체 목록을 인쇄합니다.
import sys
print(sys.argv)
노트북이 이 명령으로 실행되는 경우:
EXECUTE NOTEBOOK MY_DATABASE.PUBLIC.MY_NOTEBOOK(
  'parameter_string a,b,c,d',
  'target_database=PROD_DB'
);
출력은 다음과 같습니다.
['parameter_string', 'a,b,c,d', 'target_database=PROD_DB']
각 인자 인쇄
각 인자를 개별적으로 반복하고 인쇄합니다.
for arg in sys.argv:
    print(arg)
출력은 다음과 같습니다.
parameter_string
a,b,c,d
target_database=PROD_DB
특정 인자에 액세스
두 번째 인자에 액세스합니다.
second_param = sys.argv[1]
print(second_param)
출력은 다음과 같습니다.
a,b,c,d
쉼표로 구분된 값을 포함하는 인자 구문 분석
인자에 쉼표로 구분된 값 목록이 포함된 경우 개별 값으로 분할할 수 있습니다.
value_list = sys.argv[1].split(",")
print(value_list)
출력은 다음과 같습니다.
['a', 'b', 'c', 'd']
값을 반복할 수도 있습니다.
for value in value_list:
  print(value)
키-값 페어를 포함하는 인자 추출
인자에 키-값 페어가 포함된 경우(예: key=value), 값을 추출합니다.
target_database = sys.argv[2].split("=")
print(target_database[1])
출력은 다음과 같습니다.
PROD_DB
단일 문자열에 대한 대체 구문
:doc:`세션 변수</sql-reference/session-variables>`를 인자 값으로 설정하고 세션 변수를 노트북에 전달할 수 있습니다.
SET PARAMS = 'parameter_string a,b,c,d';
EXECUTE NOTEBOOK MY_DATABASE.PUBLIC.MY_NOTEBOOK($PARAMS);
매개 변수화된 실행의 결과 보기
:doc:`/sql-reference/sql/execute-notebook`을 사용하여 트리거된 노트북 실행의 결과를 보려면:
Snowsight 에 로그인합니다.
탐색 메뉴에서 Projects » Notebooks 를 선택합니다.
Calendar 아이콘을 선택합니다.
View run history 을 선택합니다.
노트북 실행을 찾고 결과를 엽니다.
해당 실행 결과가 포함된 읽기 전용 노트북이 열립니다.
참고
``sys.argv``에는 :doc:`/sql-reference/sql/execute-notebook`을 통해 전달된 문자열만 포함됩니다.
문자열만 지원됩니다. 다른 데이터 타입(예: 정수)이 전달되면 NULL로 해석됩니다. 자세한 내용은 EXECUTE NOTEBOOK 섹션을 참조하십시오.
셀 상태 검사
셀 실행 상태는 셀에 표시되는 색상을 통해 표시됩니다. 이 상태 색상은 셀의 왼쪽 벽과 오른쪽 셀 탐색 맵의 두 곳에 표시됩니다.
셀 상태 색상:
파란색 점: 셀이 수정되었지만 아직 실행되지 않았습니다.
빨간색: 셀이 현재 세션에서 실행되었으며 오류가 발생했습니다.
녹색: 셀이 현재 세션에서 오류 없이 실행되었습니다.
녹색으로 이동 - 셀이 현재 실행 중입니다.
회색: 셀이 이전 세션에서 실행되었으며, 표시된 결과는 이전 세션의 결과입니다. 이전 대화형 세션의 셀 결과는 7일 동안 보관됩니다. 대화형 세션은 사용자가 일정 또는 EXECUTE NOTEBOOK SQL 명령에 의해 실행된 것이 아니라 |sf-web-interface|에서 대화형 방식으로 노트북을 실행한다는 의미입니다.
회색으로 깜박입니다. 셀이 Run All 을 선택한 후 실행 대기 중입니다.
참고
마크다운 셀에는 어떤 상태도 표시되지 않습니다.
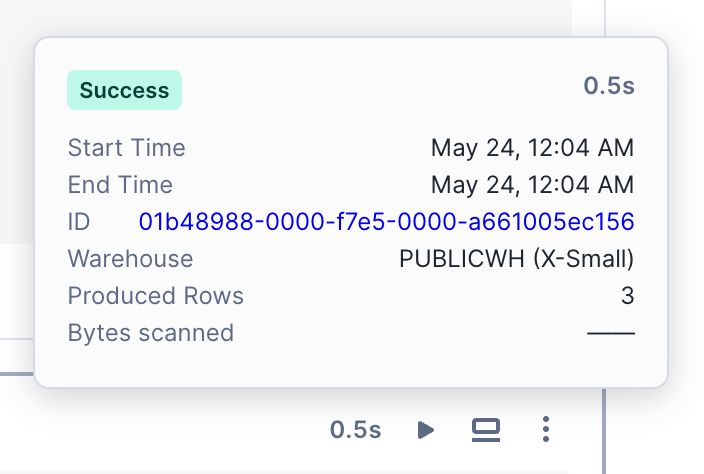
셀 실행이 완료되면, 셀 상단에 실행에 소요된 시간이 표시됩니다. 이 텍스트를 선택하면 시작 및 종료 시간, 총 경과 시간 등 실행 세부 정보를 볼 수 있습니다.
SQL 셀에는 쿼리 실행에 사용된 웨어하우스, 반환된 행, 쿼리 ID 페이지로 연결되는 하이퍼링크 등의 추가 정보가 포함되어 있습니다.
실행 중 셀 중지
현재 실행 중인 코드 셀의 실행을 중지하려면 셀의 오른쪽 상단에 있는 Stop 을 선택합니다. 노트북 페이지의 오른쪽 상단에서 Stop 을 선택할 수도 있습니다. 셀이 실행되는 동안 Run all 은 Stop 이 됩니다.
이렇게 하면 현재 실행 중인 셀과 실행이 예약된 모든 후속 셀의 실행이 중지됩니다.
바로 가기 키
Snowflake Notebooks 는 다양한 키보드 단축키를 지원하여 개발 프로세스를 가속화할 수 있습니다.
오른쪽 하단의 키보드 아이콘을 선택한 다음 Keyboard shortcuts 을 선택하면 키보드 단축키 목록을 볼 수도 있습니다.
작업 |
MacOS |
Windows |
|---|---|---|
모든 셀을 실행합니다. |
CMD + Shift + Return |
CTRL + Shift + Enter |
선택한 셀을 실행합니다. |
CMD + Return |
CTRL + Enter |
선택한 셀을 실행하고 다음 셀로 이동합니다. |
Shift + Return |
Shift + Enter |
셀 사이를 이동합니다. |
위로 및 아래로 화살표 |
위로 및 아래로 화살표 |
모든 셀 중지 |
ii |
ii |
셀 내부를 찾습니다. |
CMD + f |
CTRL + f |
셀 위로 이동 |
CMD + SHIFT + 위쪽 화살표 |
CTRL + SHIFT + 위쪽 화살표 |
셀 아래로 이동 |
CMD + SHIFT + 아래쪽 화살표 |
CTRL + SHIFT + 아래쪽 화살표 |
현재 선택된 셀 위에 셀을 추가합니다. |
a |
a |
현재 선택된 셀 아래에 셀을 추가합니다. |
b |
b |
현재 선택된 셀을 삭제합니다. |
dd 또는 DELETE |
dd 또는 DELETE |
SQL 또는 Python 셀을 Markdown 셀로 변환합니다. |
m |
m |
셀을 코드 셀로 변환합니다.
|
y |
y |
키보드 단축키 표시 |
Shift + ? |
Shift + ? |
또한 워크시트에 사용하는 것과 동일한 단축키를 사용할 수 있습니다. 키보드 단축키를 사용하여 작업 수행 섹션을 참조하십시오.
마크다운으로 텍스트 서식 지정
노트북에 마크다운을 포함하려면 마크다운 셀을 추가합니다.
키보드 단축키 를 사용하여 Markdown 을 선택하거나 + Markdown 을 선택합니다.
Edit markdown 연필 아이콘을 선택하거나 셀을 두 번 클릭하고 마크다운 작성을 시작합니다.
유효한 마크다운을 입력하여 텍스트 셀을 서식 지정할 수 있습니다. 입력하면 서식이 지정된 텍스트가 마크다운 구문 아래에 나타납니다.
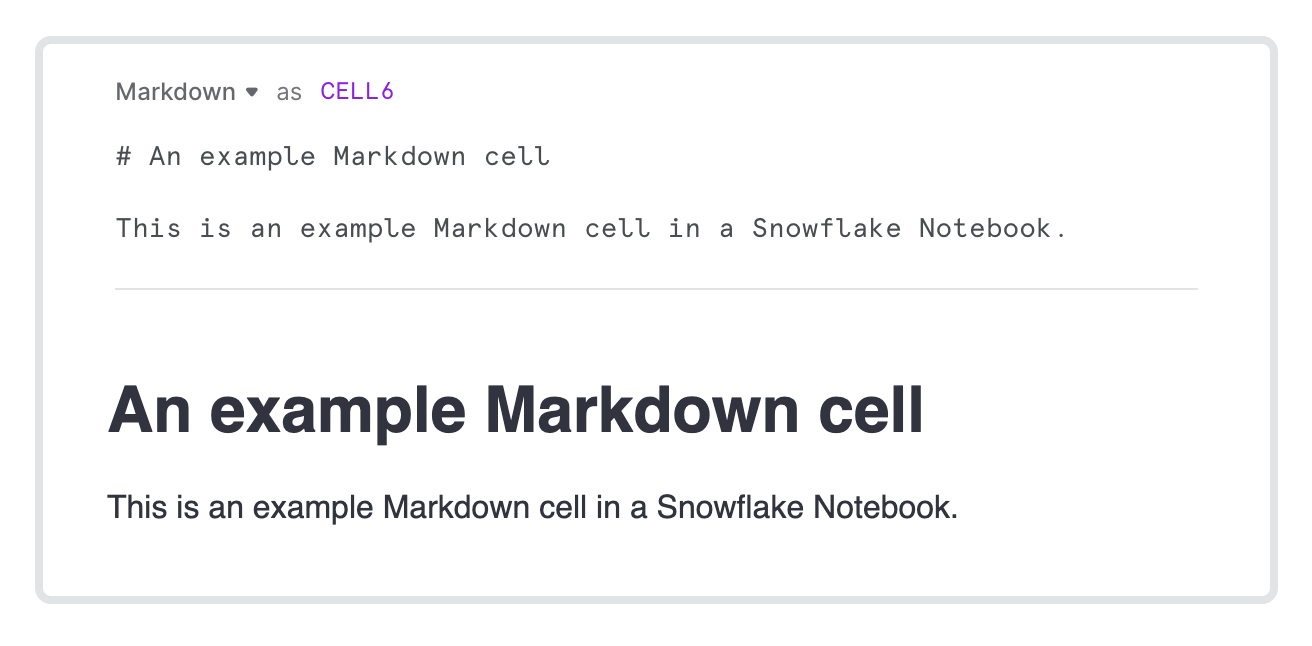
서식이 지정된 텍스트만 보려면 Done editing 체크 표시 아이콘을 선택합니다.
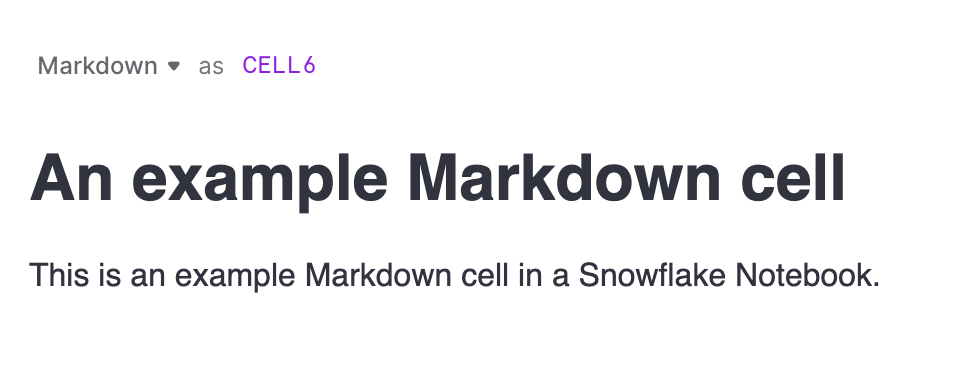
참고
마크다운 셀은 현재 HTML 렌더링을 지원하지 않습니다.
마크다운 기본 사항
이 섹션에서는 시작하는 데 도움이 되는 기본 마크다운 구문을 설명합니다.
헤더
헤딩 수준 |
마크다운 구문 |
예 |
|---|---|---|
1단계 수준 |
# Top-level Header
|

|
2단계 수준 |
## 2nd-level Header
|

|
3단계 수준 |
### 3rd-level Header
|

|
인라인 텍스트 서식
텍스트 형식 |
마크다운 구문 |
예 |
|---|---|---|
이탤릭체 |
*italicized text*
|

|
굵게 |
**bolded text**
|

|
링크 |
[Link text](url)
|

|
목록
목록 유형 |
마크다운 구문 |
예 |
|---|---|---|
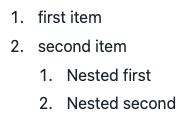
정렬된 목록 |
1. first item
2. second item
  1. Nested first
  2. Nested second
|
|
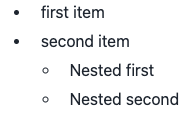
순서 없는 목록 |
- first item
- second item
  - Nested first
  - Nested second
|
|
코드 서식
언어 |
마크다운 구문 |
예 |
|---|---|---|
Python |
```python
import pandas as pd
df = pd.DataFrame([1,2,3])
```
|

|
SQL |
```sql
SELECT * FROM MYTABLE
```
|

|
이미지 삽입
파일 유형 |
마크다운 구문 |
예 |
|---|---|---|
이미지 |

|

|
이러한 Markdown 예제를 보여주는 노트북은 시각적 데이터 스토리 노트북의 Markdown 셀 섹션을 참조하십시오.
셀 출력 이해하기
Python 셀을 실행하면 노트북의 결과에 셀의 출력 유형이 다음과 같이 표시됩니다.
로그, 오류, 경고 등 콘솔에 기록된 모든 결과와 print() 문으로 출력된 결과입니다.
DataFrames 은 Streamlit의 대화형 테이블 디스플레이,
st.dataframe()로 데이터 프레임이 자동으로 인쇄됩니다.지원되는 DataFrame 디스플레이 유형에는 pandas DataFrame, Snowpark DataFrames, Snowpark 테이블이 있습니다.
Snowpark의 경우
.show()명령을 실행할 필요 없이 DataFrames 을 출력하여 적극적으로 평가합니다. 예를 들어, 노트북을 비대화형 모드로 실행할 때와 같이 DataFrame 을 즉시 평가하지 않으려면 Snowflake는 Snowpark 코드의 전체 런타임을 가속화하기 위해 DataFrame 인쇄 명령을 제거하는 것을 권장합니다.
시각화는 출력으로 렌더링됩니다. 데이터 시각화에 대해 자세히 알아보려면 Snowflake Notebooks 에서 데이터 시각화 섹션을 참조하십시오.
또한 Python에서 SQL 쿼리 결과에 액세스할 수 있으며 그 반대의 경우도 마찬가지입니다. Snowflake Notebooks 의 참조 셀 및 변수 섹션을 참조하십시오.
셀 출력 제한
10,000행 또는 DataFrame 출력의 8 MB 중 더 적은 수만 셀 결과로 표시됩니다. 그러나 전체 DataFrame 은 노트북 세션에서 계속 사용할 수 있습니다. 예를 들어, 전체 DataFrame 이 렌더링되지 않더라도 데이터 변환 작업을 수행할 수 있습니다.
각 셀에 대해 20 MB 의 출력만 허용됩니다. 셀 출력 크기가 20 MB 를 초과하면 출력이 삭제됩니다. 이 경우 내용을 여러 셀로 분할하는 것이 좋습니다.
Snowflake Notebooks 의 참조 셀 및 변수
노트북 셀에서 이전 셀 결과를 참조할 수 있습니다. 예를 들어, SQL의 결과 또는 Python 변수의 값을 참조하려면 다음 테이블을 참조하십시오.
참고
참조 셀 이름은 대/소문자를 구분하며 참조된 셀의 이름과 정확하게 일치해야 합니다.
Python 셀의 참조 SQL 출력:
참조 셀 유형 |
현재 셀 유형 |
참조 구문 |
예 |
|---|---|---|---|
SQL |
Python |
|
SQL 결과 테이블을 Snowpark DataFrame으로 변환합니다. 이름이 SELECT 'FRIDAY' as SNOWDAY, 0.2 as CHANCE_OF_SNOW
UNION ALL
SELECT 'SATURDAY',0.5
UNION ALL
SELECT 'SUNDAY', 0.9;
셀을 참조하여 SQL 결과에 액세스할 수 있습니다. snowpark_df = cell1.to_df()
결과를 pandas DataFrame으로 변환: my_df = cell1.to_pandas()
|
SQL 코드의 참조 변수:
중요
SQL 코드에서는 string 타입의 Python 변수만 참조할 수 있습니다. Snowpark DataFrame, pandas DataFrame 또는 기타 Python 네이티브 DataFrame 형식은 참조할 수 없습니다.
참조 셀 유형 |
현재 셀 유형 |
참조 구문 |
예 |
|---|---|---|---|
SQL |
SQL |
|
예를 들어, 이름이 SELECT * FROM {{cell2}} where PRICE > 500
|
Python |
SQL |
|
예를 들어, 이름이 Python 변수를 값으로 사용하기 c = "USA"
SQL 셀의 SELECT * FROM my_table WHERE COUNTRY = '{{c}}'
Python 변수를 식별자로 사용하기 Python 변수가 열이나 테이블 이름과 같은 SQL 식별자를 나타내는 경우: column_name = "COUNTRY"
Python 변수가 열 또는 테이블 이름( SELECT * FROM my_table WHERE {{column_name}} = 'USA'
값(따옴표 포함)으로 사용되는 변수와 식별자(따옴표 제외)로 사용되는 변수를 구분해야 합니다. 참고: Python DataFrames 참조는 지원되지 않습니다. |
노트북 실행을 위한 고려 사항
노트북은 호출자 권한을 사용하여 실행됩니다. 추가 고려 사항은 노트북의 세션 컨텍스트 변경하기 섹션을 참조하십시오.
노트북에서 사용할 Python 라이브러리를 가져올 수 있습니다. 자세한 내용은 노트북에서 사용할 Python 패키지 가져오기 섹션을 참조하십시오.
SQL 셀에서 오브젝트를 참조할 때는 지정된 데이터베이스 또는 스키마에서 오브젝트 이름을 참조하는 경우가 아니라면 정규화된 오브젝트 이름을 사용해야 합니다. 노트북의 세션 컨텍스트 변경하기 섹션을 참조하십시오.
노트북 초안은 3초마다 저장됩니다.
Git 통합 을 사용하면 노트북 버전을 유지 관리할 수 있습니다.
유휴 시간 제한 설정을 구성해 설정이 충족되면 노트북 세션을 자동으로 종료하도록 할 수 있습니다. 자세한 내용은 유휴 시간 및 재접속 섹션을 참조하십시오.
노트북 셀 결과는 노트북을 실행한 사용자에게만 표시되며 여러 세션에 걸쳐 캐시됩니다. 노트북을 다시 열면 사용자가 Snowsight 를 사용해 마지막으로 노트북을 실행했을 때의 과거 결과가 표시됩니다.
BEGIN … END(Snowflake Scripting) 은 SQL 셀에서 지원되지 않습니다. 대신 Python 셀에서 Session.sql().collect() 메서드를 사용하여 스크립팅 블록을 실행합니다.
sql호출을collect호출로 연결하여 SQL 쿼리를 즉시 실행합니다.다음 코드는
session.sql().collect()메서드를 사용하여 Snowflake 스크립팅 블록을 실행합니다.from snowflake.snowpark.context import get_active_session session = get_active_session() code_to_run = """ BEGIN CALL TRANSACTION_ANOMALY_MODEL!DETECT_ANOMALIES( INPUT_DATA => SYSTEM$REFERENCE('TABLE', 'ANOMALY_INFERENCE'), TIMESTAMP_COLNAME =>'DATE', TARGET_COLNAME => 'TRANSACTION_AMOUNT', CONFIG_OBJECT => {'prediction_interval': 0.95} ); LET x := SQLID; CREATE TABLE ANOMALY_PREDICTIONS AS SELECT * FROM TABLE(RESULT_SCAN(:x)); END; """ data = session.sql(code_to_run).collect(block=True);


