Using the History Page to Monitor Queries
The History ![]() page allows you to view and drill into the details of all queries executed in the last 14 days.
The page displays a historical listing of queries, including queries
executed from SnowSQL or other SQL clients.
page allows you to view and drill into the details of all queries executed in the last 14 days.
The page displays a historical listing of queries, including queries
executed from SnowSQL or other SQL clients.
Note
For details about reviewing query history in Snowsight, see Monitor query activity with Query History.
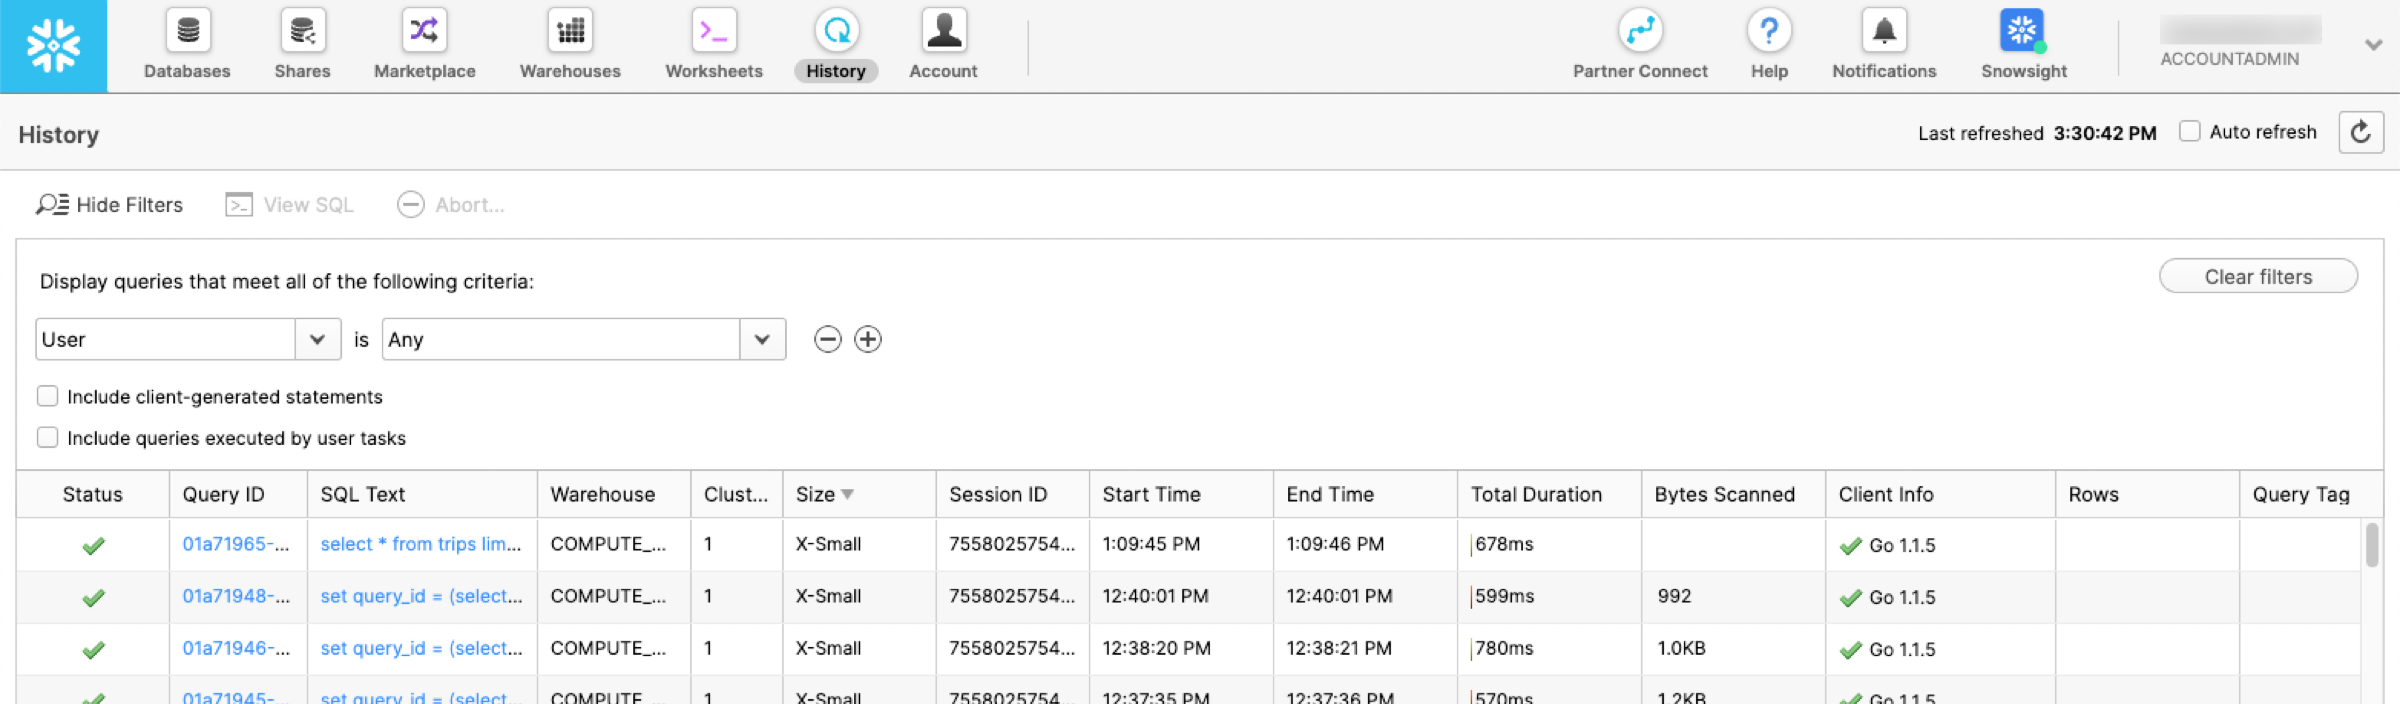
The default information displayed for each query includes:
Current status of queries: waiting in queue, running, succeeded, failed.
SQL text of your query.
Query ID.
Information about the warehouse used to execute the query.
Query start and end time, as well as duration.
Information about the query, including number of bytes scanned and number of rows returned.
Note
The Start Time and End Time columns display times in the logged-in user’s time zone. There is no option to change this setting. Session parameters do not affect this setting.
Overview of Features
Note
The History page columns are derived from the QUERY_HISTORY view. See QUERY_HISTORY view for more information, including column descriptions.
You can perform the following tasks in the History page:
Use the auto-refresh checkbox in the upper right to enable/disable auto-refresh for the session. If selected, the page is refreshed every 10 seconds. You can also click the Refresh icon to refresh the display at any time.
Use the Show/Hide Filters toggle to open/close a panel where you can specify one or more filters that control the queries displayed on the page. Filters you specify are active for the current session.
Use the Include client-generated statements checkbox to show or hide SQL statements run by web interface sessions outside of SQL worksheets. For example, whenever a user navigates to the Warehouses
 , Snowflake executes a SHOW WAREHOUSES statement in the background. Clear the Include client-generated statements checkbox to hide this “noise” in the list of displayed queries.
Use the Include queries executed by user tasks checkbox to show or hide SQL statements executed or stored procedures called by user tasks.
Scroll through the list of displayed queries. The list includes (up to) 100 of the first queries that match your filters, or the latest 100 queries (when no filters are applied). At the bottom of the list, if more queries are available, you can continue searching, which adds (up to) 100 of the next matching queries to the list.
Click any column header to sort the page by the column or add/remove columns in the display.
Click the text of a query (or select the query and click View SQL) to view the full SQL for the query.
Select a query that has not yet completed and click Abort to abort the query.
Click the ID for a query to view the details for the query, including the result of the query and the Query Profile.
Note
The History page displays queries executed in the last 14 days, starting with the most recent ones. You can use the End Time filter to display queries based on a specified date; however, if you specify a date earlier than the last 14 days, no results are returned.
Viewing Query Details and Results
Snowflake persists the result of a query for a period of time, after which the result is purged. This limit is not adjustable. For more information, see Using Persisted Query Results.
To view the details and result for a particular query, click the Query ID in the History page. The Query Detail page appears (see below), where you can view query execution details, as well as the query result (if still available).
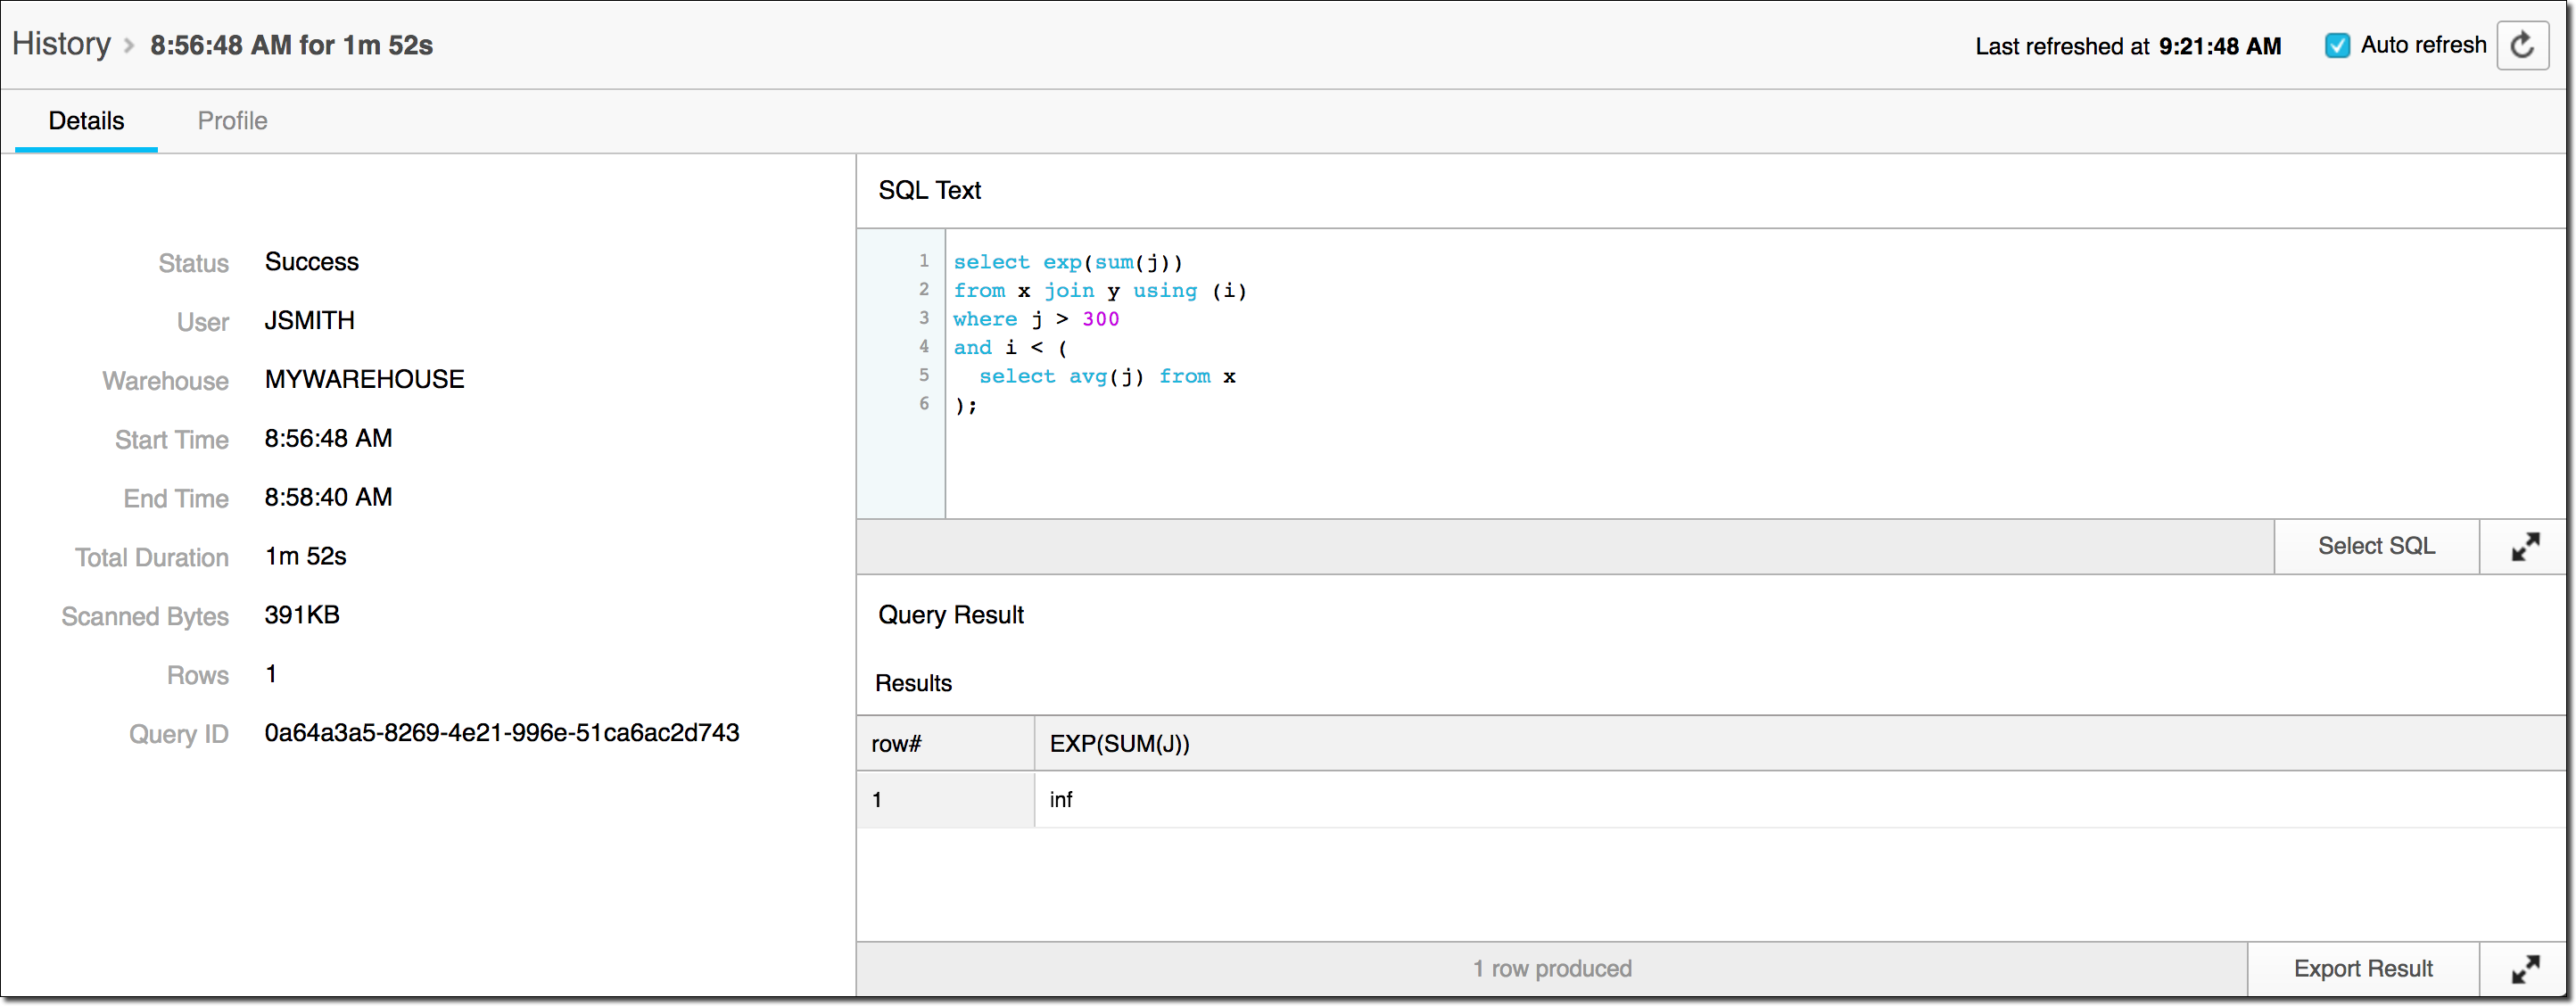
You can also use the Export Result button to export the result of the query (if still available) to a file.
Note
You can view results only for queries you have executed. If you have privileges to view queries executed by another user, the Query Detail page displays the details for the query, but, for data privacy reasons, the page does not display the actual query result.
Exporting Query Results
On any page in the interface where you can view the result of a query (e.g. Worksheets, Query Detail), if the query result is still available, you can export the result to a file.
When you click the Export Result button for a query, you are prompted to specify the file name and format. Snowflake supports the following file formats for query export:
Comma-separated values (CSV)
Tab-separated values (TSV)
Note
You can export results only for queries for which you can view the results (i.e. queries you’ve executed). If you didn’t execute a query or the query result is no longer available, the Export Result button is not displayed for the query.
The web interface only supports exporting results up to 100 MB in size. If a query result exceeds this limit, you are prompted whether to proceed with the export.
The export prompts may differ depending on your browser. For example, in Safari, you are prompted only for an export format (CSV or TSV). After the export completes, you are prompted to download the exported result to a new window, in which you can use the Save Page As… browser option to save the result to a file.
Viewing Query Profile
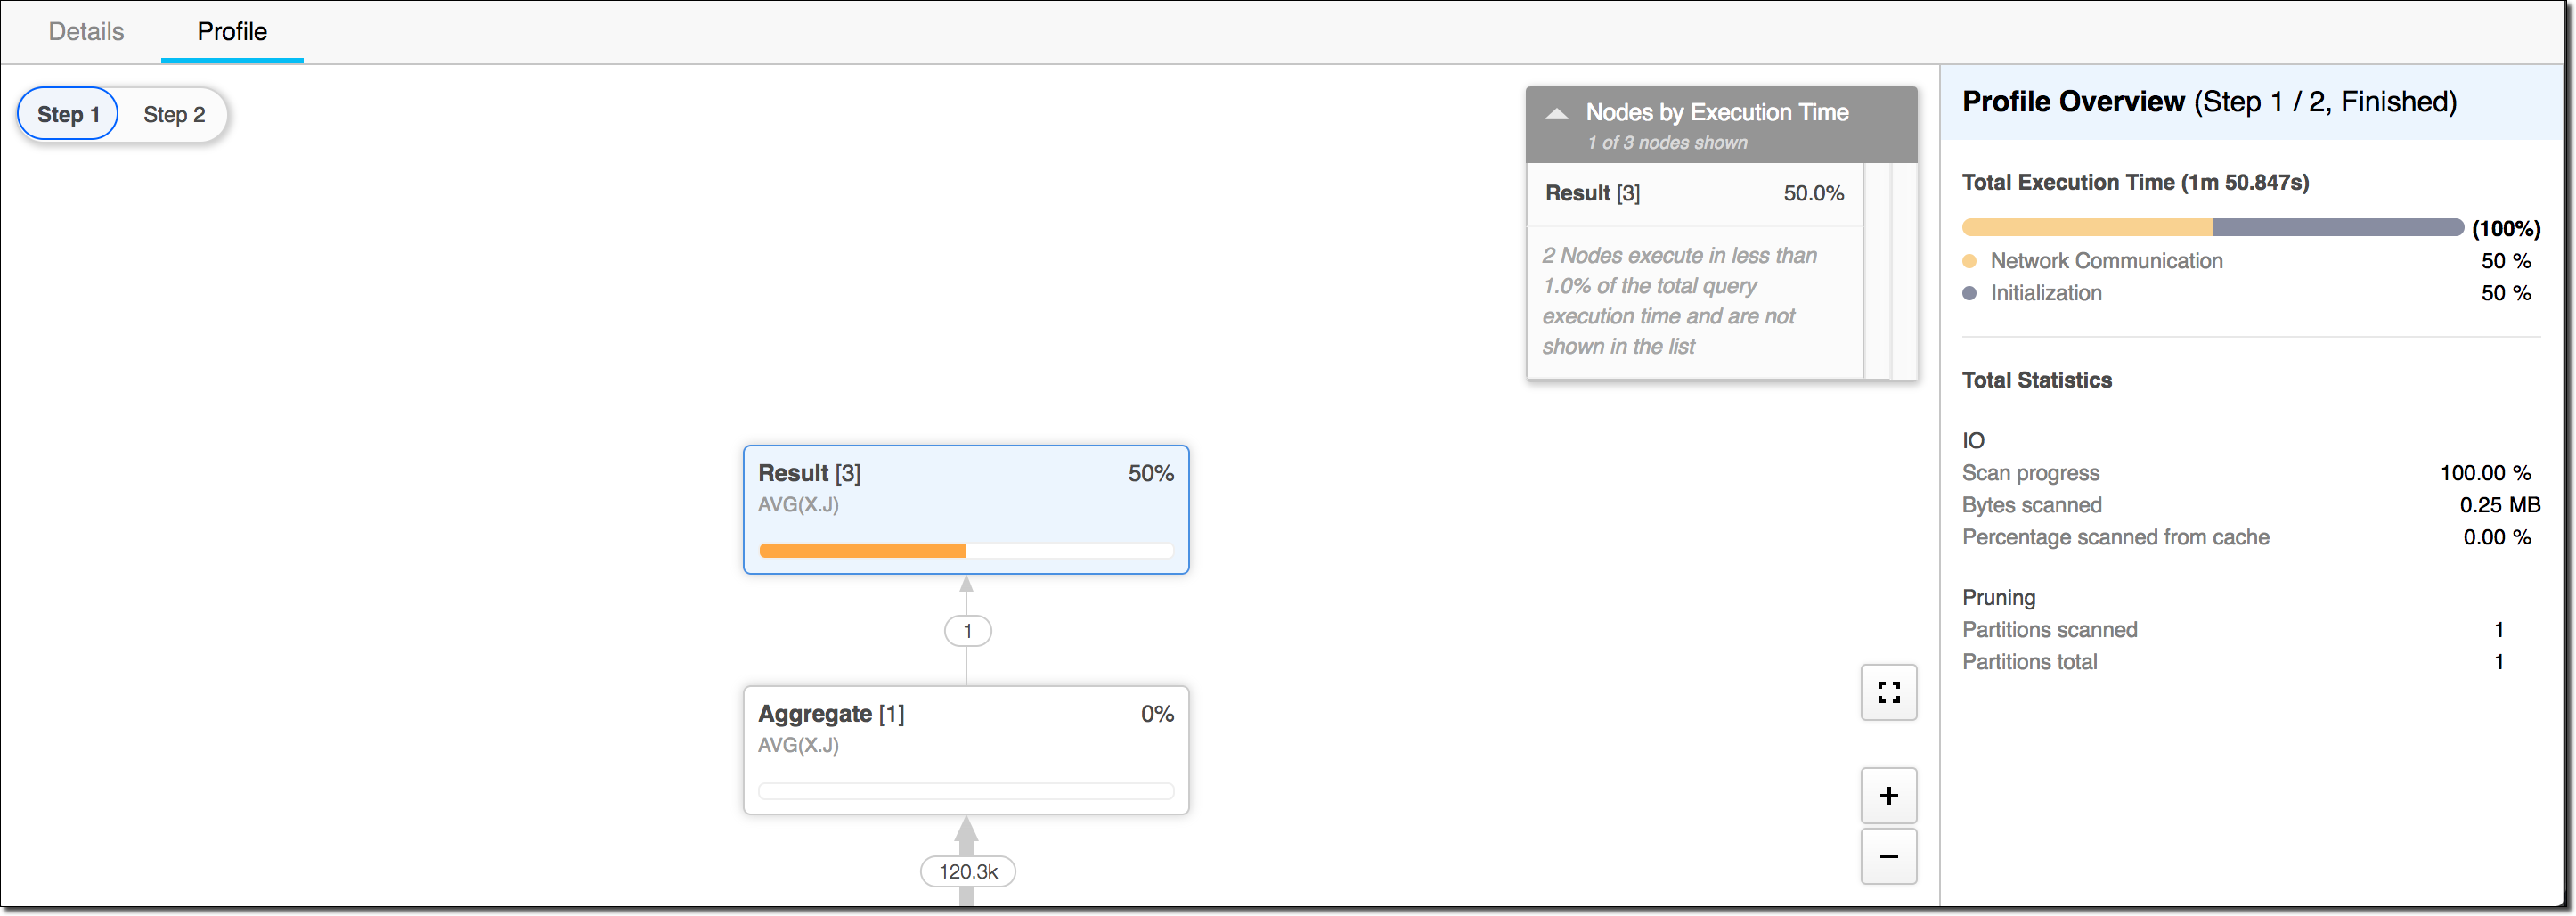
In addition to query details and results, Snowflake provides the Query Profile for analyzing query statistics and details, including the individual execution components that comprise the query. For more information, see Querying data using worksheets.
Query History Data Redacted from a Snowflake Native App
For queries related to a Snowflake Native App, the query_text and error_message fields are redacted
from the query history in the following contexts:
Queries run when the app is installed or upgraded.
Queries that originate from a child job of a stored procedure owned by the app.
In each of these situations, the cell of the query history in Snowsight appears blank.