Monitoring and Observability
You can monitor the health of your feature store pipelines, online serving endpoint, and stream ingestion directly in Snowsight. The monitoring view is available under AI & ML » Features and is organized into three tabs:
- Offline Refresh: Status of offline refresh jobs for all feature views in the feature store.
- Online Serving: Visualize metrics related to online serving, including latency percentiles, query volume, and error rates for online feature retrieval.
- Stream Ingest: Visualize metrics related to ingestion for stream feature views, including throughput, latency, and concurrency for streaming feature pipelines.
Prerequisites
- A feature store must already exist. For more information, see Creating or connecting to a feature store.
- For Online Serving and Stream Ingest metrics, online service must be created and running. For more information, see Create the online service.
- Online Serving metrics are only shown when online serving is enabled for at least one feature view in the feature store.
- Stream Ingest metrics are only shown when at least one stream feature view exists in the feature store.
- A warehouse is required to run monitoring queries. You can select the warehouse from the warehouse selector at the top of each tab.
- Navigate to the Feature Store monitoring view:
- Sign in to Snowsight.
- In the navigation menu, select AI & ML » Features.
- Select a feature store from the dropdown.
- Select a sub-tab: Offline Refresh, Online Serving, or Stream Ingest.
Offline Refresh
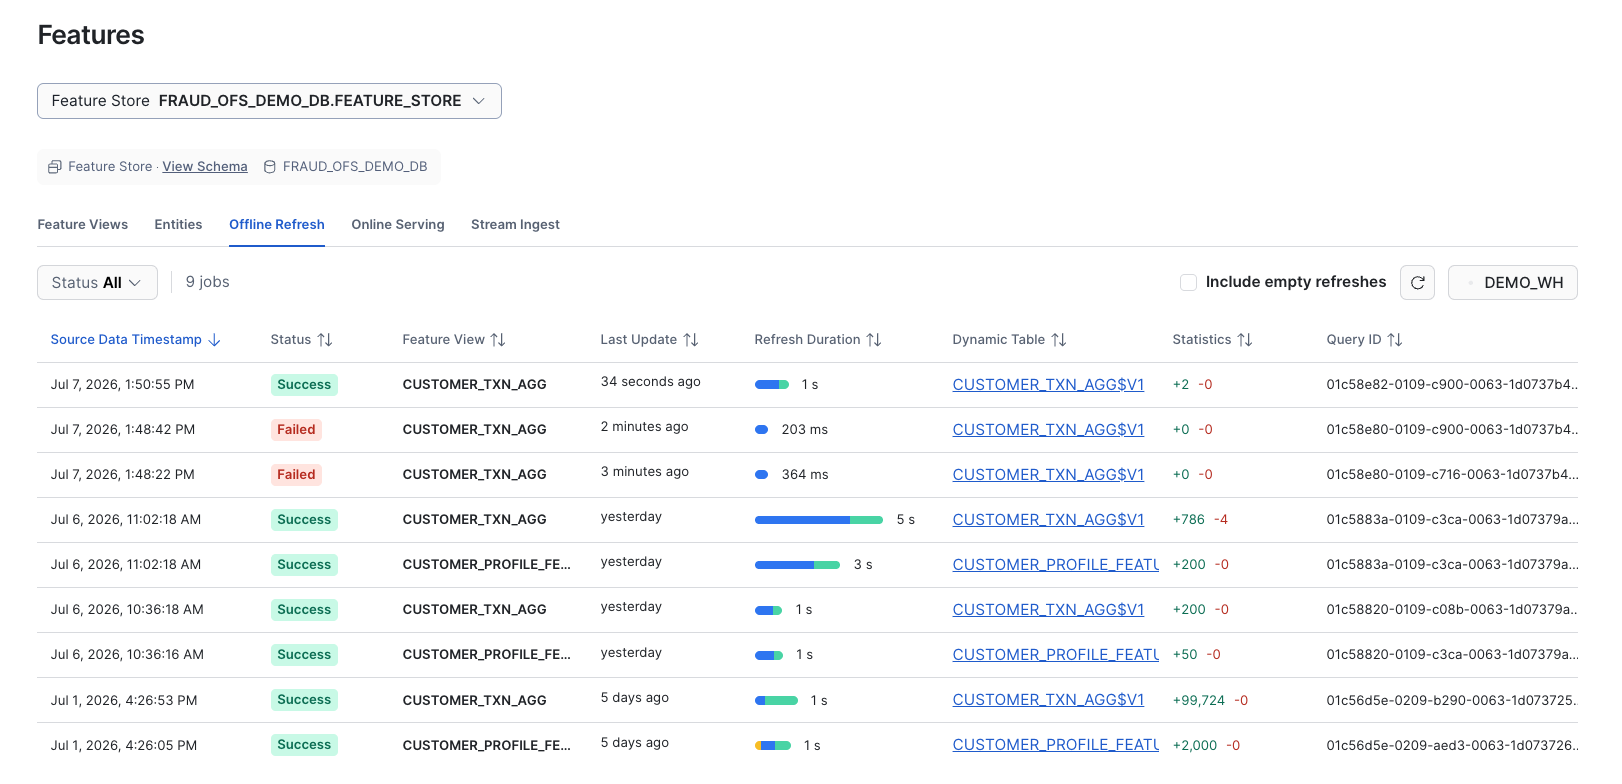
The Offline Refresh tab lists offline refresh jobs for all feature views in the feature store. Each row represents one refresh job. By default, empty refreshes (refreshes with no changed rows) are hidden. Only refreshes with changed rows are displayed. To display empty refreshes, select Include empty refreshes.
Columns
The Offline Refresh tab includes the following columns:
| Column | Description |
|---|---|
| Source Data Timestamp | The timestamp of the upstream source data that triggered this refresh. This is the primary sort column. |
| Status | The outcome of the refresh job. For more information, see Refresh status values. |
| Feature View | The name of the feature view in |
| Last Update | The time the refresh record was last updated. |
| Refresh Duration | How long the refresh job ran. Displayed as a bar for visual comparison across rows. |
| Dynamic Table | The underlying dynamic table. Select the link to open the dynamic table refresh history page in Snowsight. |
| Statistics | Row-level change counts for this refresh: rows inserted (+) and rows deleted (−). |
| Query ID | The Snowflake query ID for the refresh job. |
Refresh status values
The Offline Refresh tab uses the following status values:
| Status | Description |
|---|---|
| Success | The refresh completed successfully. Feature values are up to date. |
| Failed | The refresh job failed. Select the Dynamic Table link to see the error details in the dynamic table refresh history page. After 5 consecutive scheduled failures, Snowflake automatically suspends the dynamic table. |
| Running | A refresh is currently in progress. |
| Suspended | The dynamic table has been suspended, either manually or after repeated failures. No new refreshes run until the dynamic table is manually resumed. |
Note
The Offline Refresh tab uses information from INFORMATION_SCHEMA.DYNAMIC_TABLE_REFRESH_HISTORY, which retains data for 7 days. For
longer retention (up to 365 days, with up to 3 hours latency), query
DYNAMIC_TABLE_REFRESH_HISTORY view directly.
Online Serving
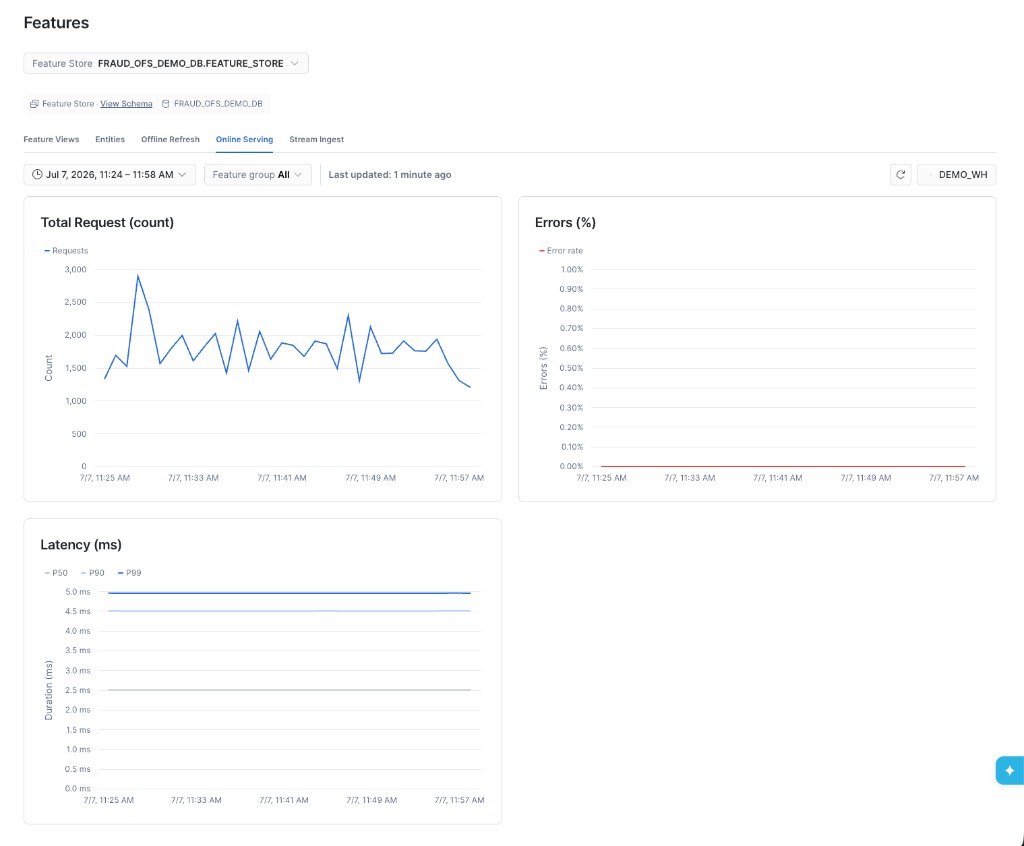
The Online Serving tab displays metrics for your online feature retrieval endpoint. Use this tab to monitor request volume, track latency against your SLA targets, and identify errors in serving.
Note
This tab is only shown when online serving is enabled for at least one feature view in the feature store.
Visualize metrics
Total Request
The total number of online feature retrieval requests over the selected time window, across all scopes or for the selected feature group or feature view.
Errors (%)
Failed requests as a percentage of total requests. A value of 0% indicates that all requests are completing without errors. An increase in this value indicates errors in online serving.
Latency (ms)
Server-side latency in milliseconds for online feature retrieval requests, shown as three percentiles: p50, p90, and p99.
Filter by scope
Use the Scope selector at the top of the tab to filter all charts. You can view aggregate metrics for the entire feature store or narrow the view to a specific feature group or feature view:
- All: Aggregate metrics across all feature groups and feature views in the feature store.
- Feature group: Filter to a specific feature group shown in
name$versionformat, for exampleuser_features$v1. - Feature view: Filter to a specific feature view shown in
name$versionformat.
Note
The Online Serving tab reflects telemetry from the Postgres-backed Online Feature Store. Feature views backed by hybrid tables are not currently supported.
Stream Ingest
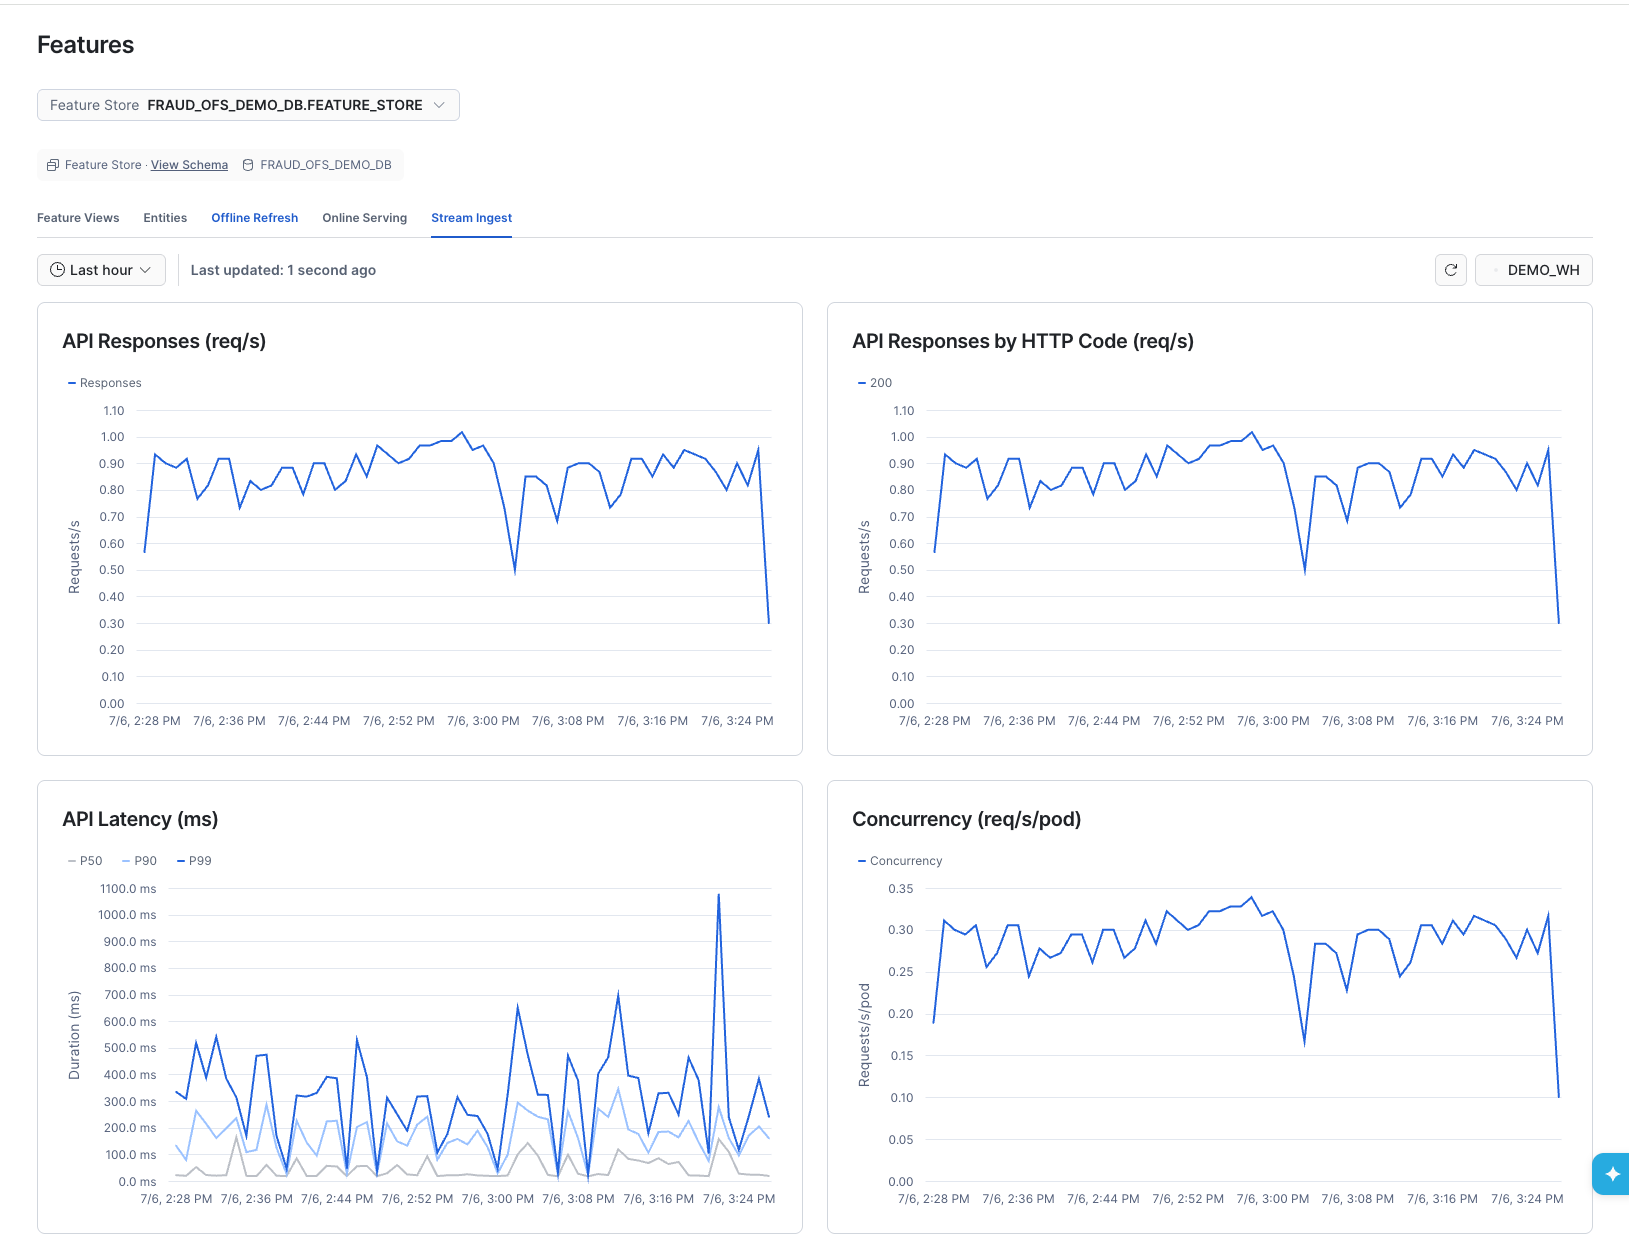
The Stream Ingest tab shows the health and throughput of your streaming feature pipelines. Use this tab to verify that the stream ingest API is processing events at the expected rate, meeting latency targets, and handling concurrent request volume without errors.
Note
This tab is only shown when at least one stream feature view exists in the feature store.
Visualize metrics
Ingest API Responses Per Second
The total number of stream ingest API responses per second, indicating the throughput of incoming streaming events.
Ingest API Responses by HTTP Code
Response volume broken down by HTTP response code. Use this chart to detect elevated error rates or throttling. A spike in 429 responses indicates that the ingest rate is exceeding the provisioned limit.
Ingest API Latency
Server-side latency in milliseconds for stream ingest API requests, shown as four percentiles (p50, p90, p95, p99). This latency is used to measure the amount of time it takes to ingest streaming events into the feature store.
Concurrency
A metric for concurrent ingest load, derived by dividing QPS at the ingest endpoint by the number of provisioned compute nodes. The default number of provisioned compute nodes is 3, and the online service autoscales according to load. Snowflake scales up or scales down the number of nodes when aggregated CPU usage crosses an 80% threshold. For more information, see How CPU-based autoscaling works. Use this chart to identify bursts of concurrent requests that may cause throttling errors.
Diagnosing stream ingest issues
Use the following table to interpret common symptoms on the Stream Ingest tab:
| Symptom | Likely cause |
|---|---|
| High p99 latency | Large payload per request, or a burst of concurrent requests exceeding available capacity. |
| Elevated 5xx errors | Runtime errors or resource throttling. Check the Concurrency chart for correlated spikes. |
| Elevated 4xx errors | Malformed request payload or a schema mismatch between the payload and the feature view schema. |
| Flat or zero ingest rate | The upstream stream source may have stopped producing events, or the ingest endpoint is unreachable. |