Use Snowsight to work with cost anomalies
This topic describes how to use Snowsight to identify and investigate cost anomalies, create anomaly monitors that watch a custom scope, and configure notifications.
All of the tasks in this topic start on the Anomalies tab. To open it:
- Sign in to Snowsight as a user with the required privileges.
- In the navigation menu, select Admin » Cost management, and then select Anomalies.
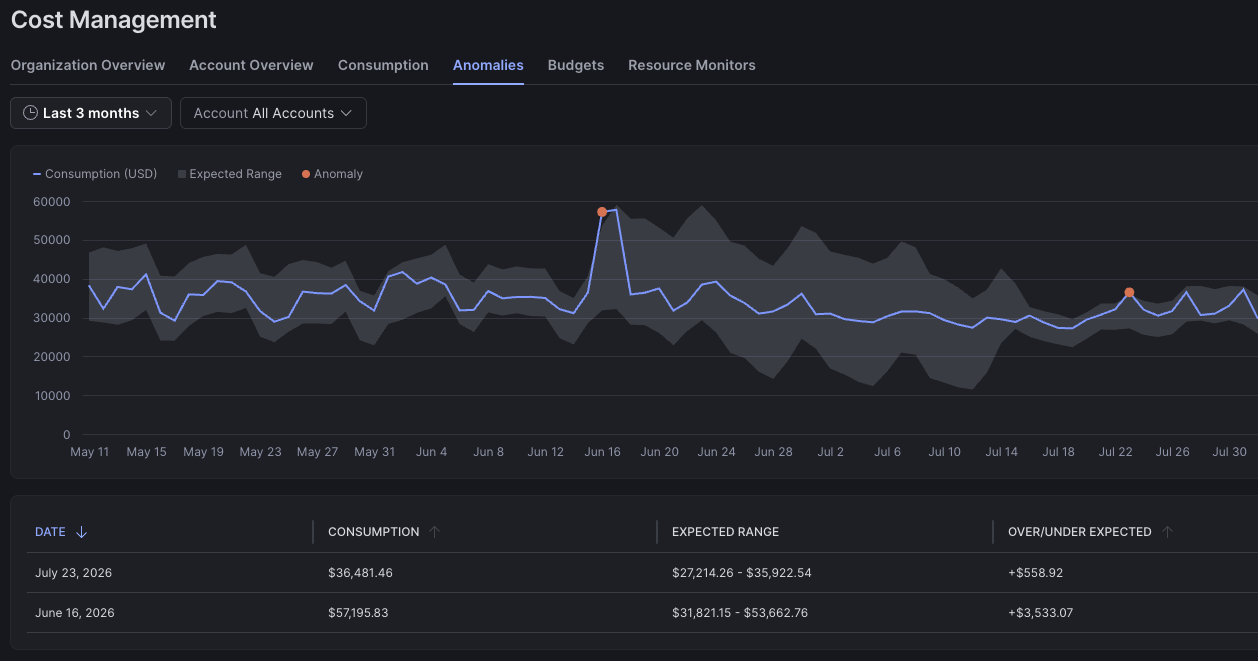
The Anomalies tab opens, showing a consumption chart with the expected range and any detected anomalies, and a table of those anomalies:
Identify and investigate cost anomalies with Snowsight
Step 1: Identify cost anomalies
-
Open the Anomalies tab.
-
Use the filters to select a timeframe, and then choose what you want to review:
- A single account: From the Account filter, select the account. The chart and table show account-level anomalies for that account.
- The whole organization: From the Account filter, select All accounts. The chart and table show organization-level anomalies.
- An anomaly monitor: From the Account filter, select the account you’re currently signed in to, and then select a monitor from the Monitors filter. Monitor filters appear only for the current account. For more information, see Work with anomaly monitors in Snowsight.
-
Use the chart to track actual consumption against the expected range over time, or use the table to list and sort every anomaly in the timeframe.
Step 2: Investigate a cost anomaly
You can investigate an anomaly using the side panel, which supports account-level and organization-level anomalies, or Cortex Code, which also supports anomaly monitors.
Investigate using the side panel
The side panel isn’t available for anomaly monitors. To investigate an anomaly that a monitor detected, use Cortex Code.
To open the side panel, select a cost anomaly by clicking the indicator in the chart or selecting a row in the table.
For an account-level anomaly, where you selected a specific account, you can drill down into the following:
- Top consumption drivers: hourly consumption within the account, either for all service types or for the services that consumed the most credits during the day.
- Top warehouses: the warehouses with the greatest absolute change in consumption.
- Top queries: the most expensive queries in the warehouse that had the greatest change in consumption. Available only for the account you’re signed in to. Because it focuses on a single warehouse, it might not show the account’s most expensive query. Select the Open in Worksheet icon near a query ID to open it in a worksheet.
For an organization-level anomaly, where you selected All accounts, you can drill down into the following:
- Top accounts: the accounts with the greatest absolute change in consumption.
- Top warehouses: within the account that had the greatest change, the warehouses with the greatest change. Because it focuses on a single account, it might not show the organization’s top warehouse. To retrieve the top warehouses for another account or the whole organization, see Warehouse-level consumption.
Tip
If the Anomalies tab doesn’t provide the data you need to identify the root cause, select the Consumption tab.
Investigate with Cortex Code
Cortex Code is an AI-driven intelligent agent integrated into the Snowflake platform. You can investigate a cost anomaly by highlighting a section of the consumption chart and asking natural-language questions. Cortex Code works for every kind of anomaly, including those detected by an anomaly monitor, so Cortex Code is the only way to investigate a monitor’s anomalies in Snowsight.
To use Cortex Code, you need the required privileges to access it in Snowsight.
-
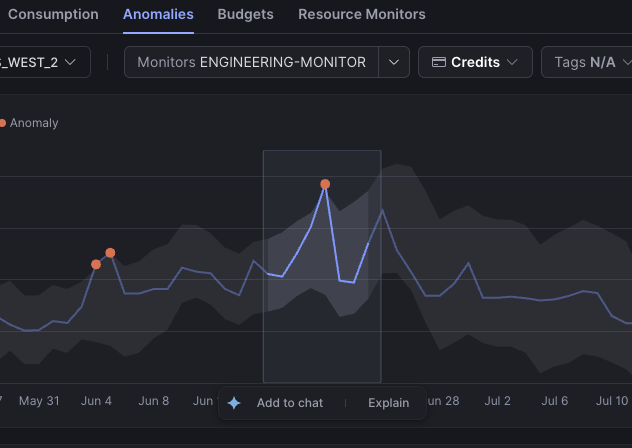
Highlight activity in the consumption chart that you want to investigate, such as a spike in compute costs. The Add to chat and Explain quick actions appear.
-
Select one of the following quick actions:
- Explain: Cortex Code analyzes the highlighted anomaly and returns an explanation of what caused it, along with other insights about the consumption.
- Add to chat: Start a Cortex Code chat with the highlighted anomaly as context, where you can enter your own prompts.
-
Cortex Code reports its findings. It might ask you to run SQL statements to gather more information, such as a statement that identifies the warehouses, queries, or users that contributed to a spike.
Example prompts
The following prompts cover different types of analysis:
| Use case | Example prompt |
|---|---|
| Gather general information about a cost change | What changed in this highlighted window? |
| Determine the cause of a cost spike | Why did this cost spike occur? |
| Identify cost drivers | Which top warehouses contributed the most to this increase? |
| Get recommendations to reduce costs | What can I do to reduce these costs? |
| Investigate specific cost categories | What queries caused this compute cost increase? |
For more information, see Cortex Code.
Work with anomaly monitors in Snowsight
An anomaly monitor watches a scope that you define with object tags and service types, rather than a whole account. Use the filters on the Anomalies tab to build a scope, review the anomalies it produces, and then save it as a named monitor.
Because a monitor is scoped to a single account, the filters appear only when the Account filter is set to the account you’re currently signed in to.
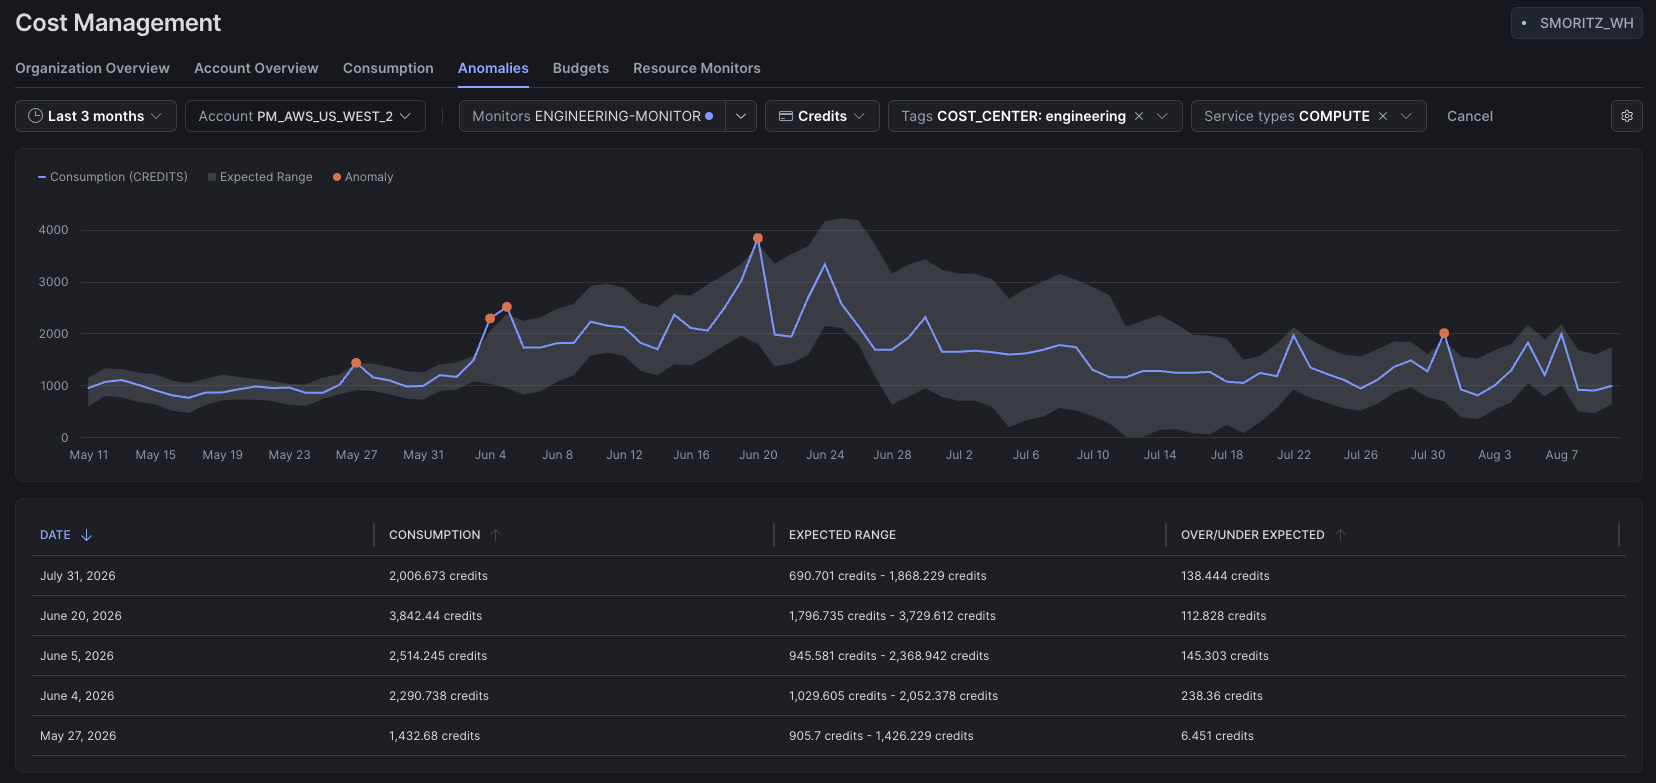
The following filters control a monitor’s scope:
| Filter | Description |
|---|---|
| Monitors | Lists every monitor in the current account. Select one to review it, or start a new scope. |
| Credit family | Selects the credit family the monitor tracks, either Credits or AI Credits. This determines which service types you can add, and limits tag-attributed consumption to that credit family. |
| Tags | Adds tag and value pairs to the scope. Consumption from resources carrying a matching tag is attributed to the monitor, if it belongs to the
selected credit family. You need the |
| Service types | Adds account-level service types to the scope. An included service type’s consumption is attributed in full, for the whole account, regardless of the scope’s tags. |
Create a monitor
- On the Anomalies tab, select the account you’re currently signed in to from the Account filter.
- From the Credit family filter, select the credit family you want the monitor to track.
- Define the scope by selecting at least one tag from the Tags filter, at least one service type from the Service types filter, or a combination of both.
- Review the chart and table, which update to show the anomalies your scope produces, and adjust the filters as needed. Snowflake computes unsaved results on demand, so they take longer to appear than a saved monitor’s, and they are lost when your session ends.
- Select the caret next to the Monitors filter, select Create new monitor from config, and then enter a name. The name must be unique within the account and isn’t case-sensitive.
Manage a monitor
To view a saved monitor, select it from the Monitors filter. The chart and table update to show that monitor’s consumption, expected range, and anomalies.
To manage the selected monitor, select the caret next to the Monitors filter:
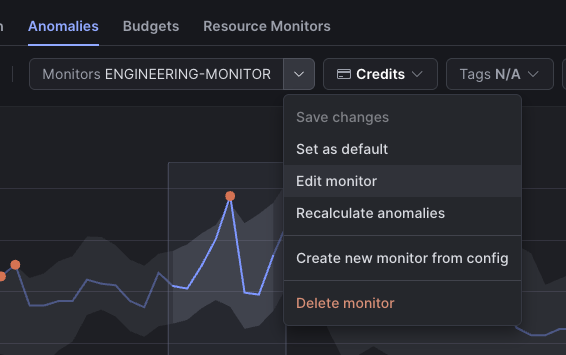
- Save changes: Saves scope changes made with the Tags and Service types filters. A blue dot on the Monitors filter indicates that the monitor has unsaved changes. The monitor keeps its name, notification list, and history. At least one tag or service type must remain selected.
- Set as default: Selects this monitor automatically when you open the Anomalies tab.
- Edit monitor: Opens a dialog where you can rename the monitor and set its notification recipients.
- Recalculate anomalies: Recomputes the monitor’s anomaly history immediately.
- Create new monitor from config: Saves the current scope as a new monitor, leaving the original unchanged.
- Delete monitor: Deletes the monitor.
Warning
Deleting a monitor permanently removes its configuration, anomaly history, and notification list. You can’t recover a deleted monitor.
Rename a monitor or set its notification recipients
Select Edit monitor to open a dialog that contains the monitor’s name and notification list.
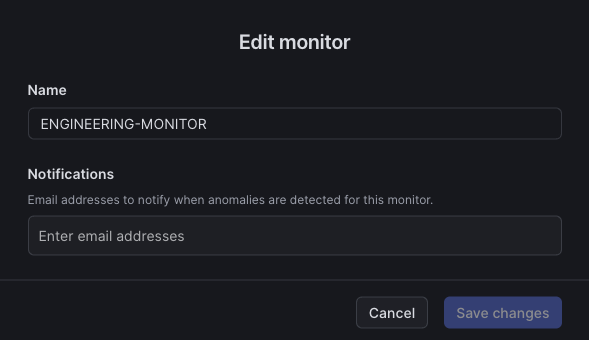
Each monitor has its own email notification list, separate from the account-level and organization-level lists. Only recipients on a monitor’s list are notified when it detects an anomaly, and each address must be verified by the user.
Monitors support email notifications only. To send anomaly notifications to Slack, SMS, or a webhook, use a notification integration, which applies to account-level and organization-level anomalies.
Recalculate a monitor’s anomalies
Snowflake recomputes each monitor daily, but it can’t detect changes to which resources carry a tag. If you tag or untag resources, or change a monitor’s scope, its history can be out of date until the next daily run. Select Recalculate anomalies to refresh it immediately. Recalculation regenerates the full consumption time series and calculates any anomalies, so it takes longer than loading saved results, and the refreshed results are saved.
Configure notifications with Snowsight
When Snowflake identifies a cost anomaly, it sends a notification to a list of email addresses. When deciding who will receive notifications for cost anomalies, be aware that email notifications might contain details about how much was spent by an account.
Each account can have a notification list for account-level anomalies within the account. You can also define a separate notification list for the organization to control who is notified when there is an organization-level anomaly.
Each email address must have been verified by the user.
You can use a group email address, such as a distribution list, for notifications, but this email address must be verified. Before adding a group email address to the notification list, you might need to create a new Snowflake user with the group email address so you can verify it.
Note
Email notifications are processed through Snowflake’s Amazon Web Services (AWS) deployments, using AWS Simple Email Service (SES). The content of an email message sent using AWS may be retained by Snowflake for up to thirty days to manage the delivery of the message. After this period, the message content is deleted.
To set the recipients for account-level and organization-level anomalies, select the gear icon in the upper right corner of the Anomalies tab, enter addresses in the Notify for account anomalies and Notify for organization anomalies fields, and then select Save changes.
Anomaly monitors have their own lists, which you set with Edit monitor. See Work with anomaly monitors in Snowsight.