View tasks and task graphs in Snowsight
Tasks let you schedule the execution of SQL code. A task is associated with a specific database and schema. You can use Snowsight to view and manage your tasks and task graphs. Using Snowsight, you can also view the execution history for tasks and task graphs and retry failed tasks.
View and manage individual tasks
To view and manage a task in Snowsight, perform the following steps:
- Sign in to Snowsight.
- In the navigation menu, select Catalog » Database Explorer.
- For a specific database and schema, select Tasks and select the task you want to manage.
When viewing the task in Snowsight, you can perform the following steps:
- In the Details section, review the task ID, warehouse used by the task, schedule, state, parameters, and any conditions.
- Review the SQL statement used to create the task and any task graph configurations in the Task Definition section.
- Manage privileges on the task. For information, see Manage object privileges with Snowsight.
- To edit the task, clone the task, drop the task, or transfer ownership of the task to another role, select the … actions button.
When you edit a task in Snowsight, the task is automatically suspended, and then resumed when you finish editing the task. For more information about suspending and resuming tasks, see Versioning of task runs.
View and manage task graphs
Review a task graph to see a root task, its dependent tasks, and finalizer task in the format of a task graph. For more information about task graphs, see Create a sequence of tasks with a task graph. When you review a task graph, you can perform the following steps in Snowsight:
- View task information.
- Examine the task graph.
- Select a task on the graph to view additional details, such as predecessor tasks, the warehouse used to run the task, and the role that owns the task.
You can also edit the root task to change parameters for the task graph. When you edit a task in Snowsight, the task is automatically suspended and resumed when you finish editing the task. For more information about suspending and resuming tasks, see Versioning of task runs.
To view a task graph for a specific database schema, perform the following steps:
-
Sign in to Snowsight.
-
In the navigation menu, select Catalog » Database Explorer.
-
Use the object explorer to locate the database and schema that contain the tasks that you want to view.
-
For the selected schema, select Tasks.
-
Select a specific task.
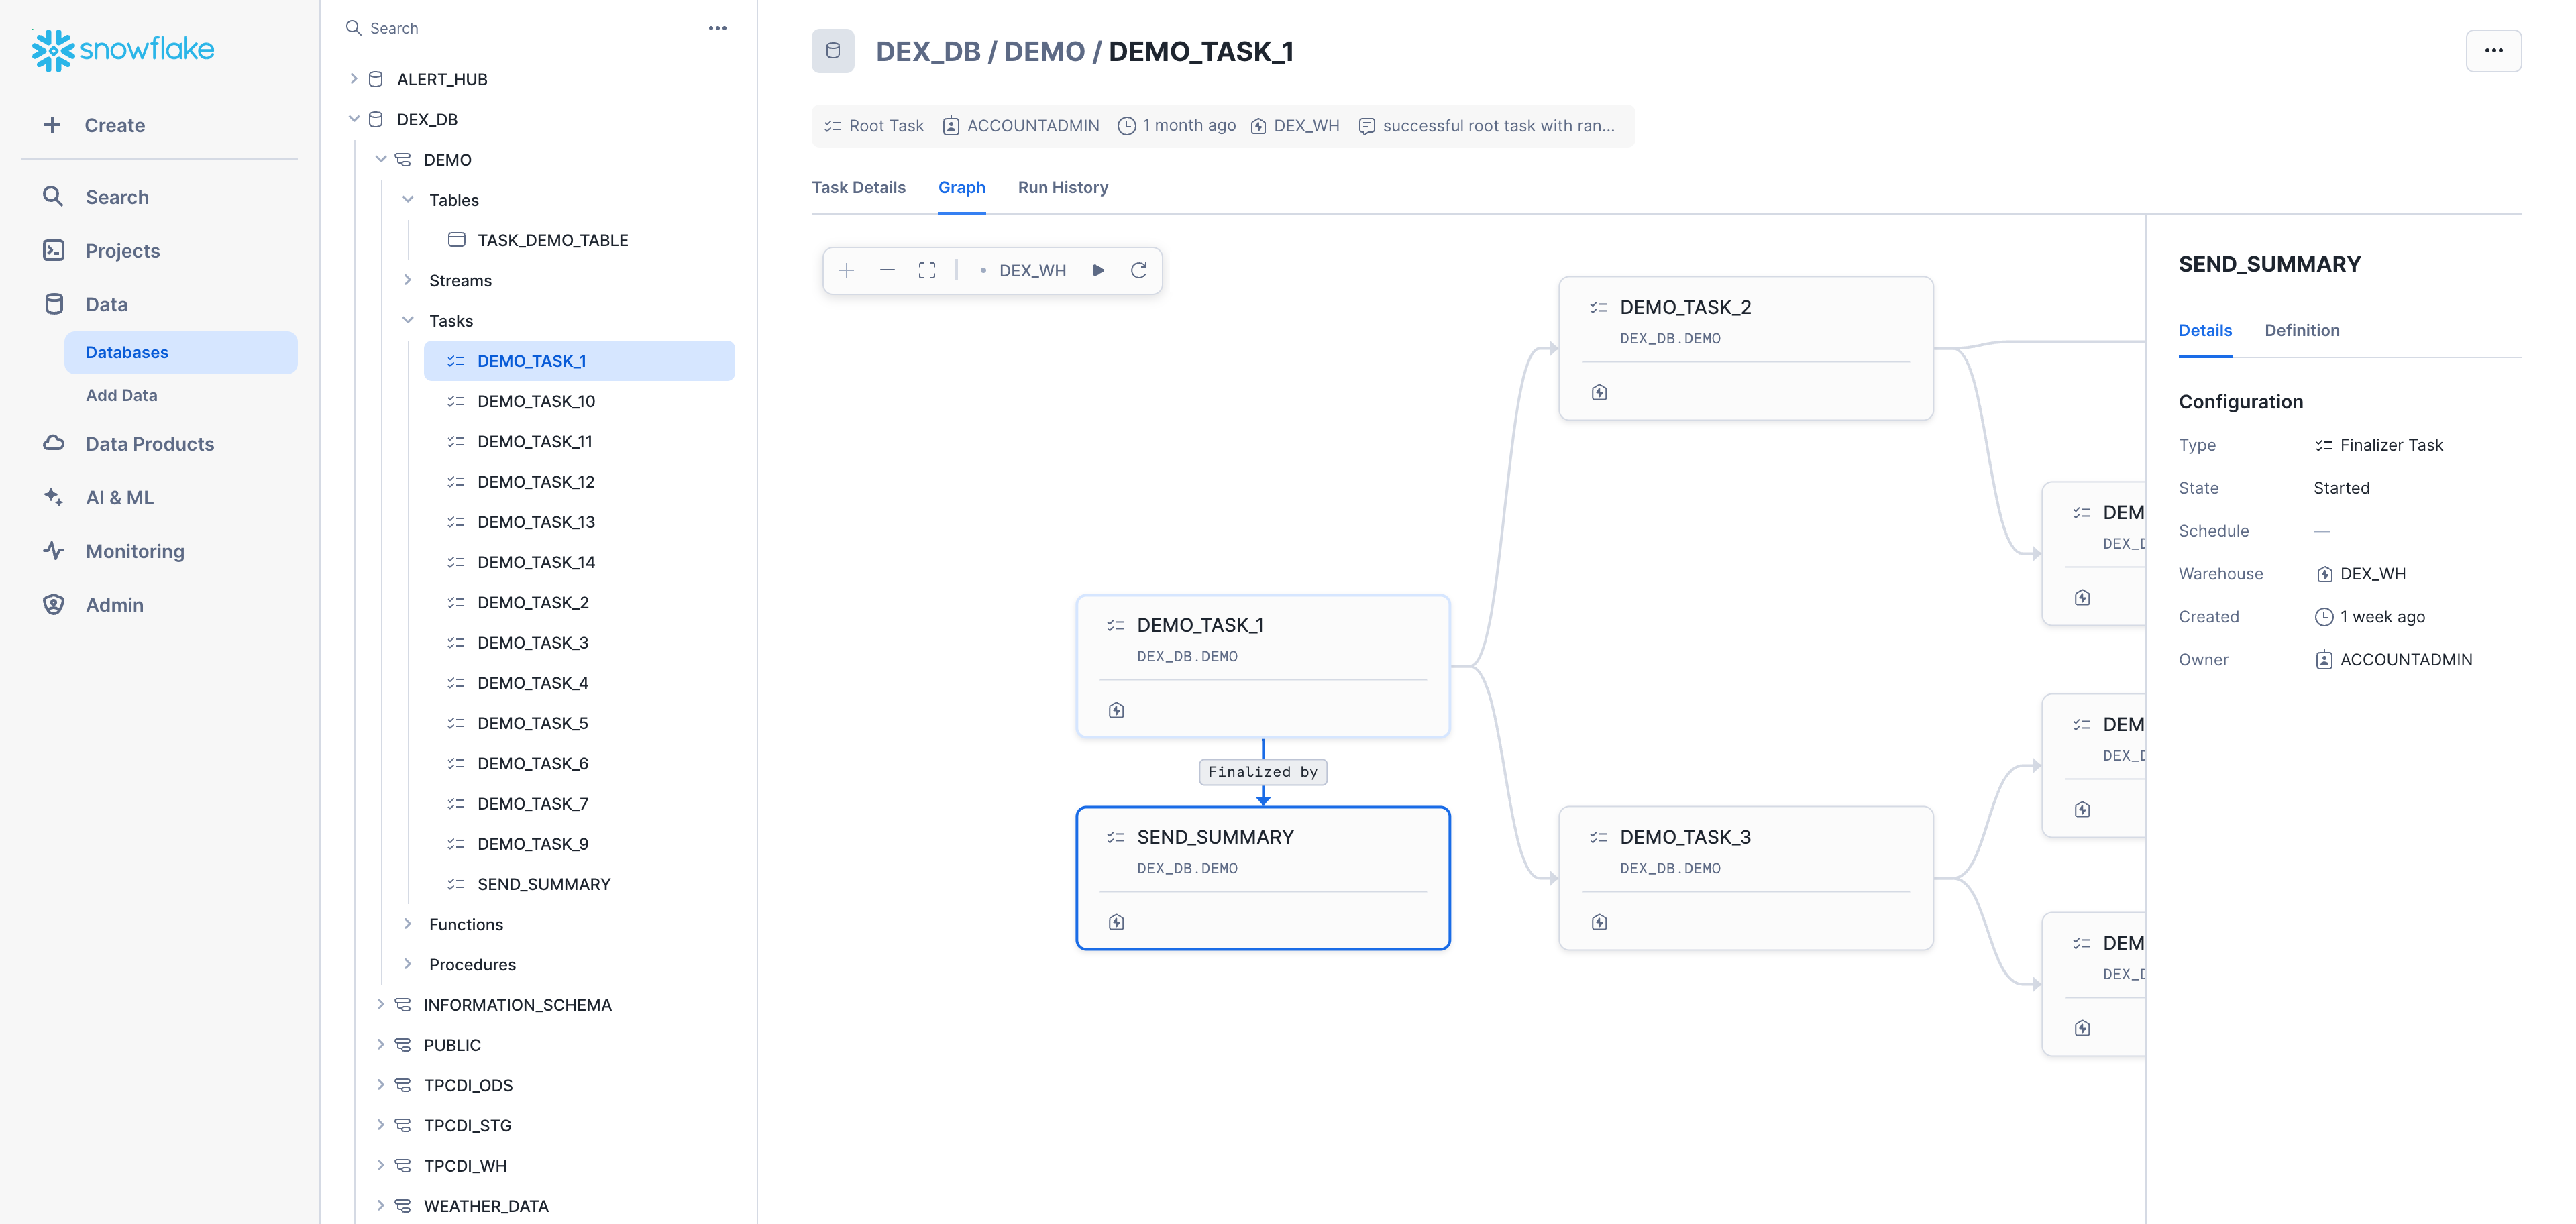
The task details appear, with additional Graph, and Run History tabs.
-
Select the Graph tab to view the task graph.
The task graph appears, displaying a hierarchy of tasks.
-
Select a task to view details in the context of the graph.
Note
Task history data is only available if the task has been executed in the last 7 days.
View task history
To view task history, perform the following steps:
- Sign in to Snowsight.
- In the navigation menu, select Transformation » Tasks.
From the Tasks page, you can see task execution history. For example:
- Review all tasks that have run in your account to help identify critical tasks that failed to run, long-running tasks, or tasks that have increasing costs.
- Review specific tasks to gather more information about the task.
- Review task graphs to observe, monitor, and help identify problems with a specific task graph.
You can also review task history in SQL by using a table function TASK_HISTORY or a view TASK_HISTORY view.
Required privileges for viewing task history
To view task history in Snowsight, you need the same privileges required to run the TASK_HISTORY function. That is, you must use a role that includes one of the following roles or privileges on the task:
- The ACCOUNTADMIN role.
- The role with the OWNERSHIP privilege on the task (that is, the task owner).
- The MONITOR or OPERATE privilege on the task.
- The global MONITOR EXECUTION privilege.
The role that you use must be able to query the Account Usage TASK_HISTORY view. You can grant the USAGE_VIEWER database role in the shared SNOWFLAKE database to the role that you use.
For example, to view the history for a specific task mytask, you can grant OWNERSHIP privileges on the task and the USAGE_VIEWER database role on the shared Snowflake database by running the following SQL commands:
For details, see:
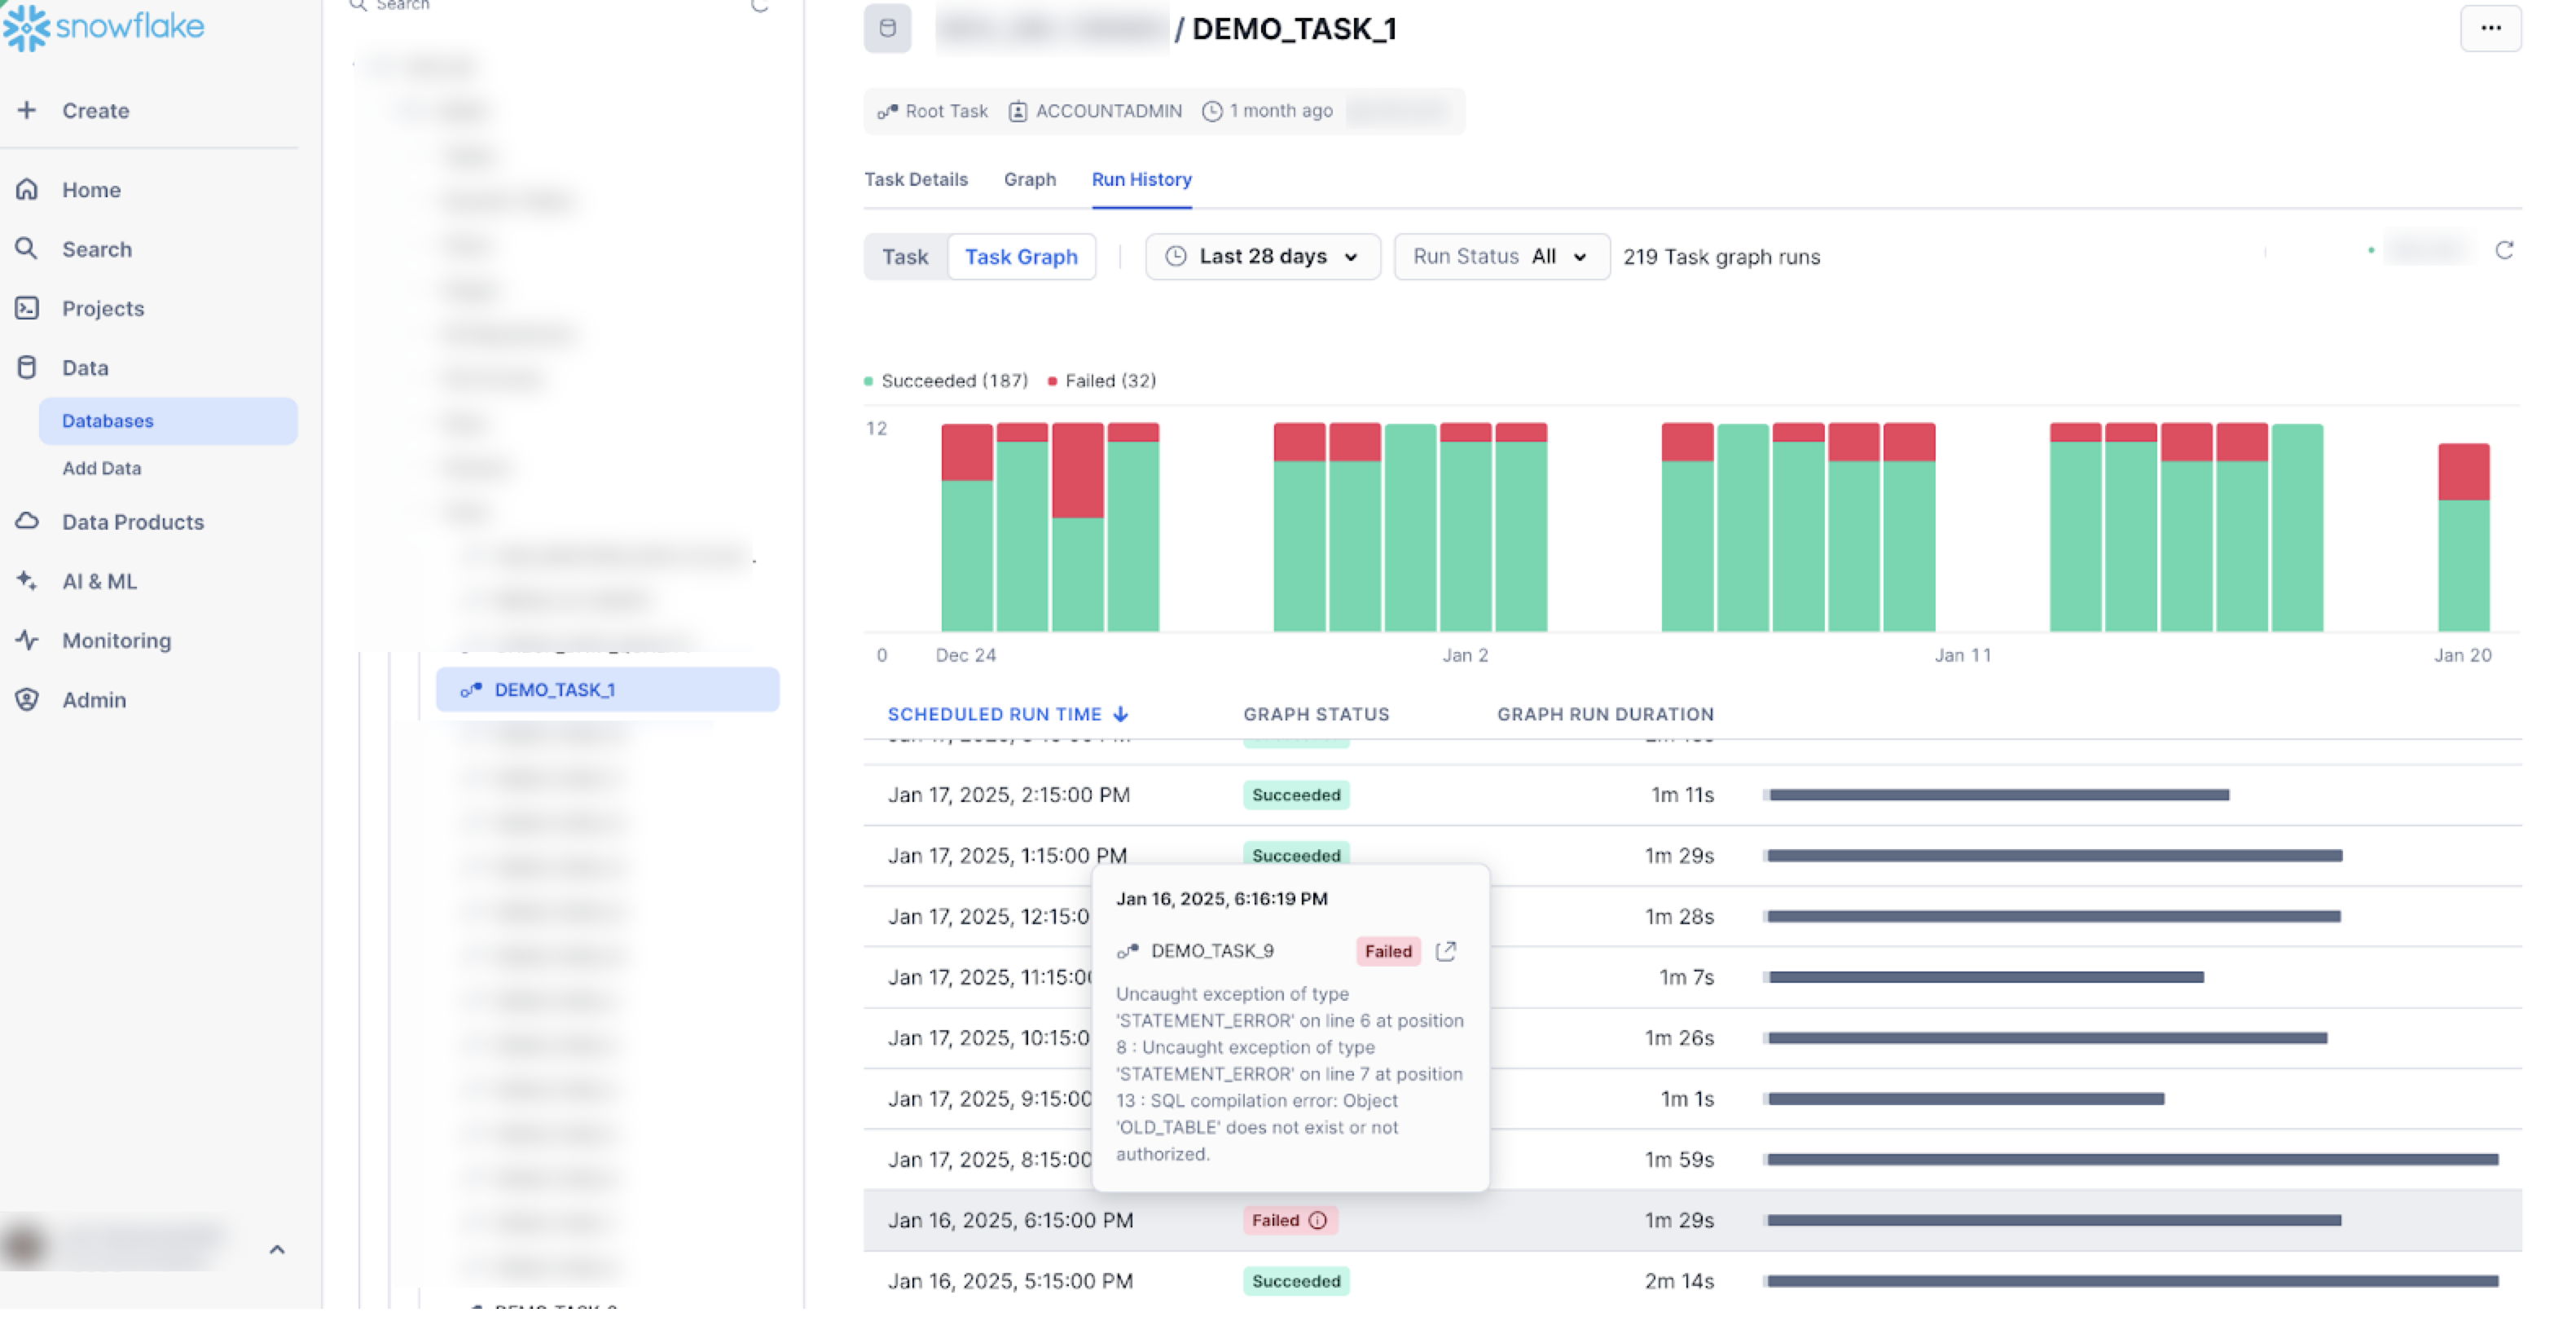
Review the run history for a task
Task run history includes details about each execution of a given task. You can view the scheduled run time, status, return value, duration of a task, and other information.
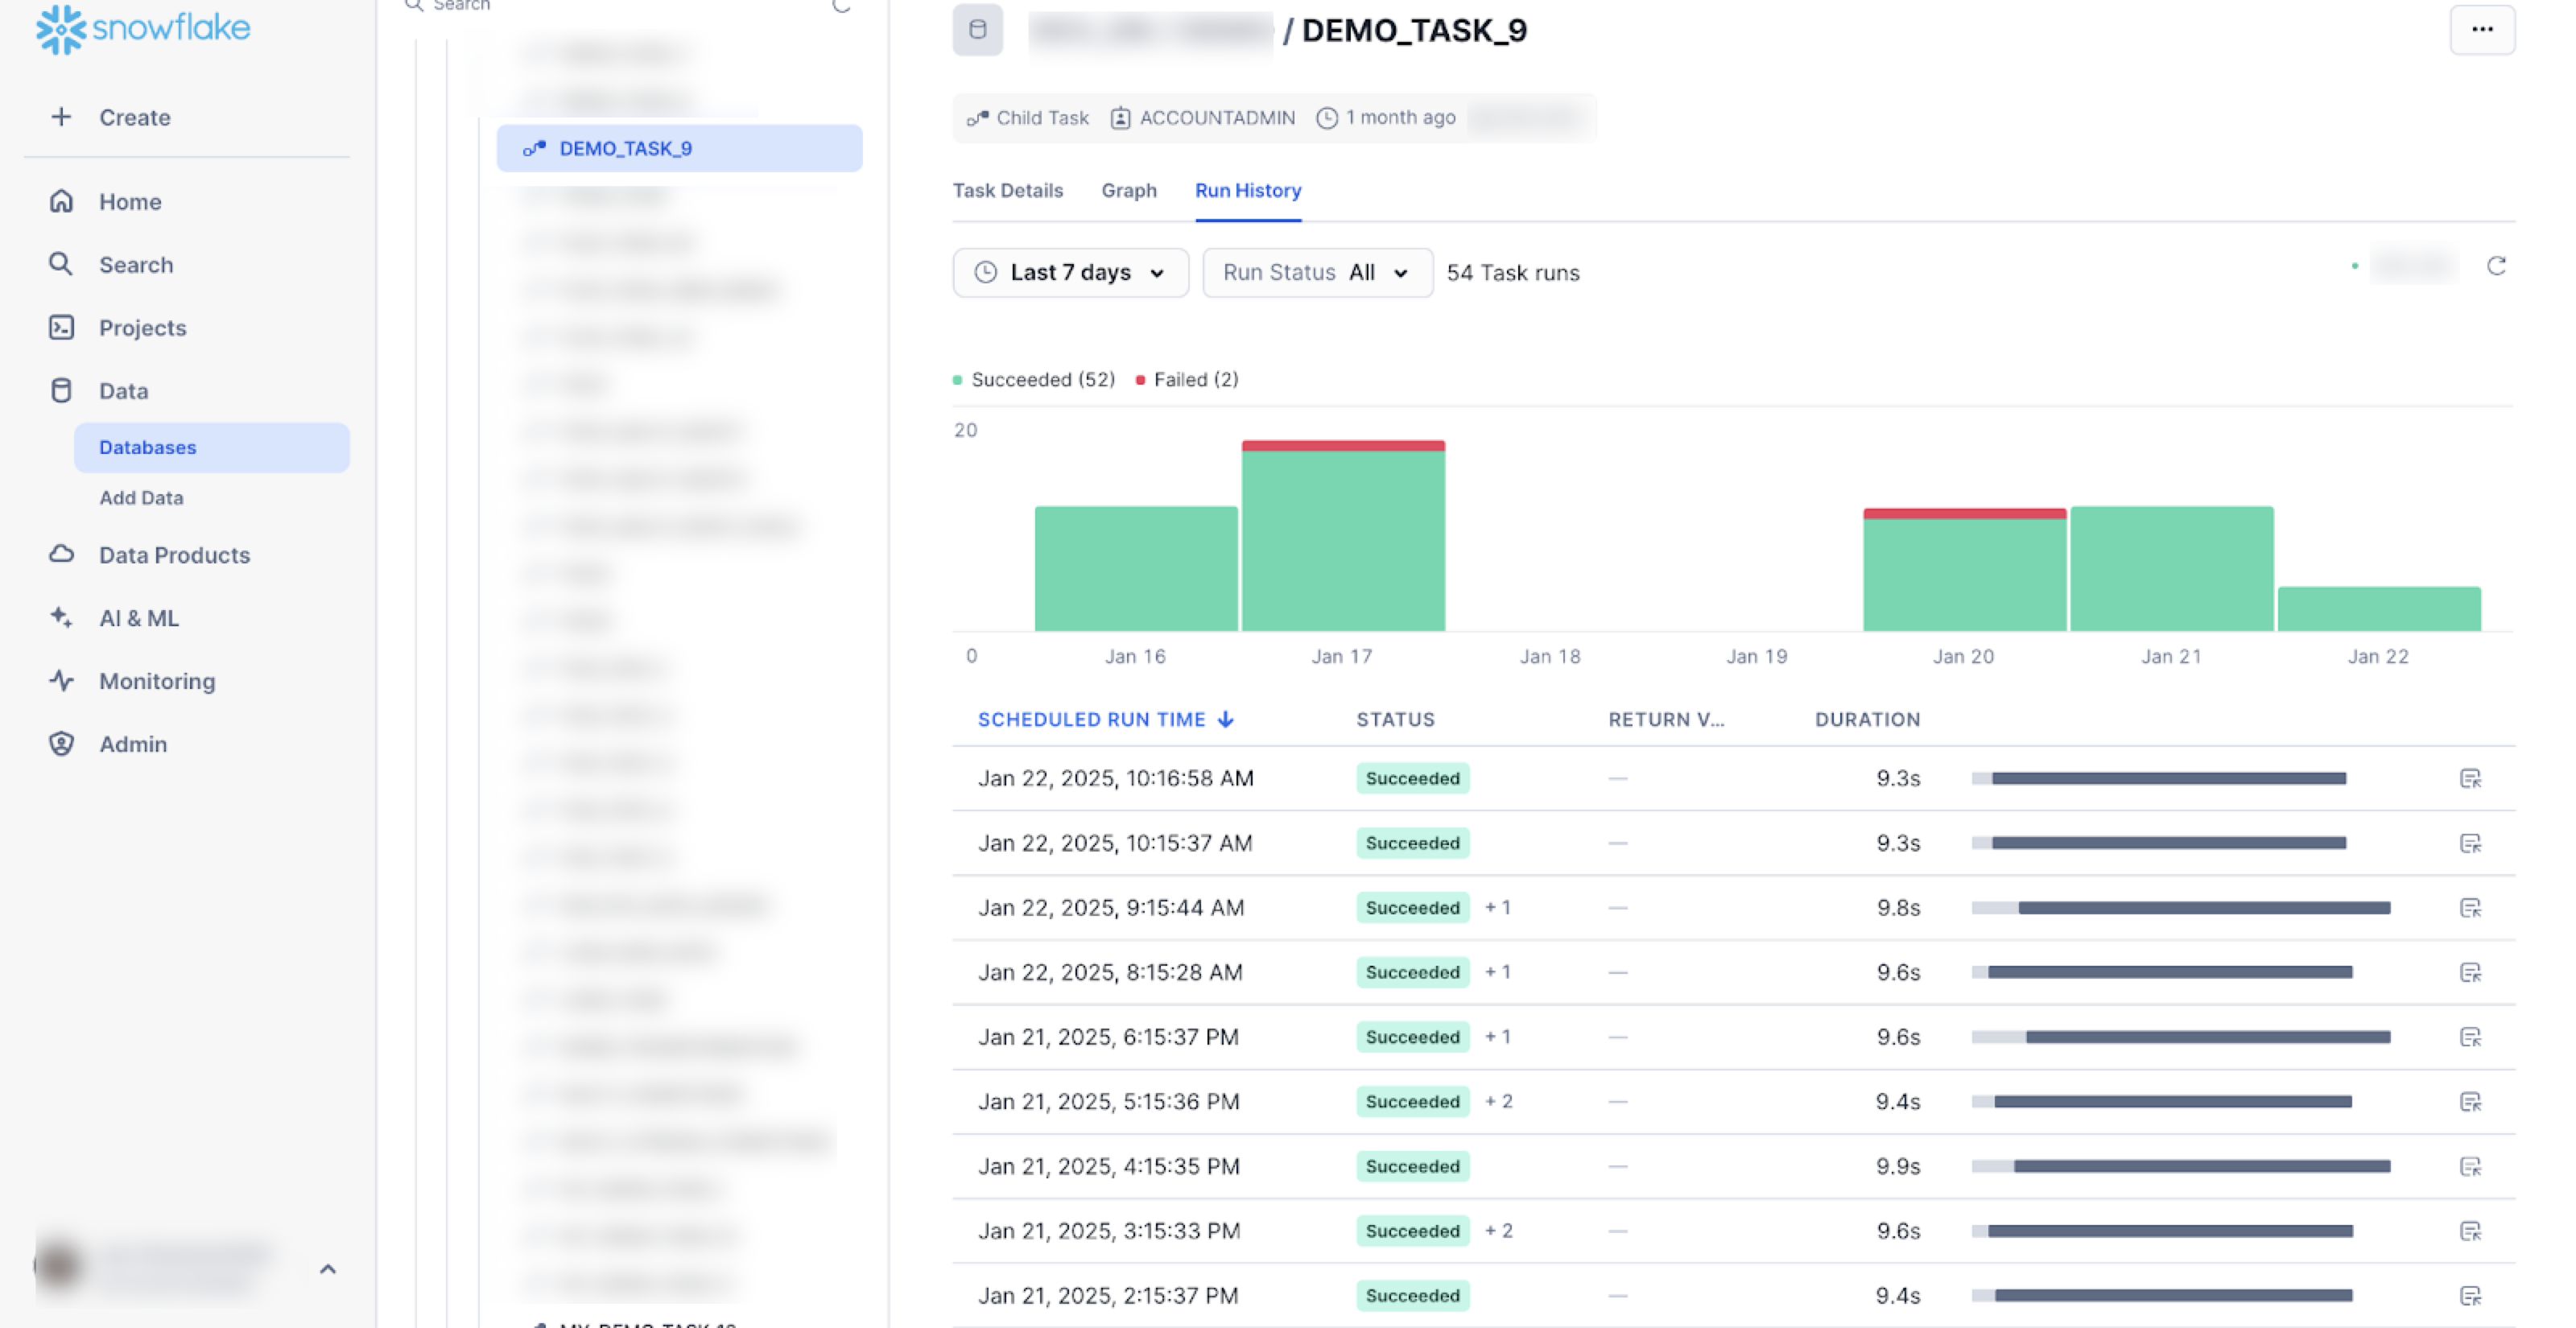
For each instance, you can view the following:
- Scheduled run time: When the scheduled task was run.
- Status: Status of the most recent attempt of the task run.
- Duration: Amount of time, in seconds, for the task run.
To view the run history:
- Sign in to Snowsight.
- In the navigation menu, select Catalog » Database Explorer.
- In the right pane, using the object explorer, navigate to a database and schema.
- For the selected schema, select and expand Tasks.
- Select a task. Task information is displayed, including Task Details, Graph, and Run History sub-tabs.
- Select the Run History tab.
Note
Task history data is only available if the task has been executed in the last 7 days.
Review account-level task history
Review the account-level history for task runs to identify failing tasks, long-running tasks, and other monitoring and debugging cases for an entire account, rather than for one specific task.
To view account-level history for tasks, perform the following steps:
- Sign in to Snowsight.
- In the navigation menu, select Transformation » Tasks.
- To view individual task runs, select View » Task Runs from the filters.
After you select the history of task runs, you can filter the page to display relevant information.
- Select the Date Range filter to show task history from the last day through the last 12 months, or a custom range.
- Select the Task status filter to display task history for one or more status, such as Succeeded, Failed, Cancelled, or Skipped.
- Filter on the name of the task to see patterns in status or duration over time for specific tasks.
- Filter on the name of the database or schema that contain the tasks.
For example, to identify long-running tasks, select the Status filter to show only successful tasks, and sort the Duration field in descending order. For advanced debugging, you can open the filtered and sorted table in worksheets using the Open in worksheets button. You could then modify the SQL statement with LIMIT / FETCH and GROUP BY arguments to identify the databases and schemas with the top 25 most long-running tasks.
You can also select a specific task to drill down for more details.
View task graph history
Viewing the Tasks page
To identify failing tasks, long-running tasks, and other monitoring and debugging cases, review the history of your task graph runs on the Tasks page.
Note
With the Tasks page, you can view the task graph runs based on your specific role privileges.
To view task graph runs, take the following steps:
- Sign in to Snowsight.
- In the navigation menu, select Transformation » Tasks.
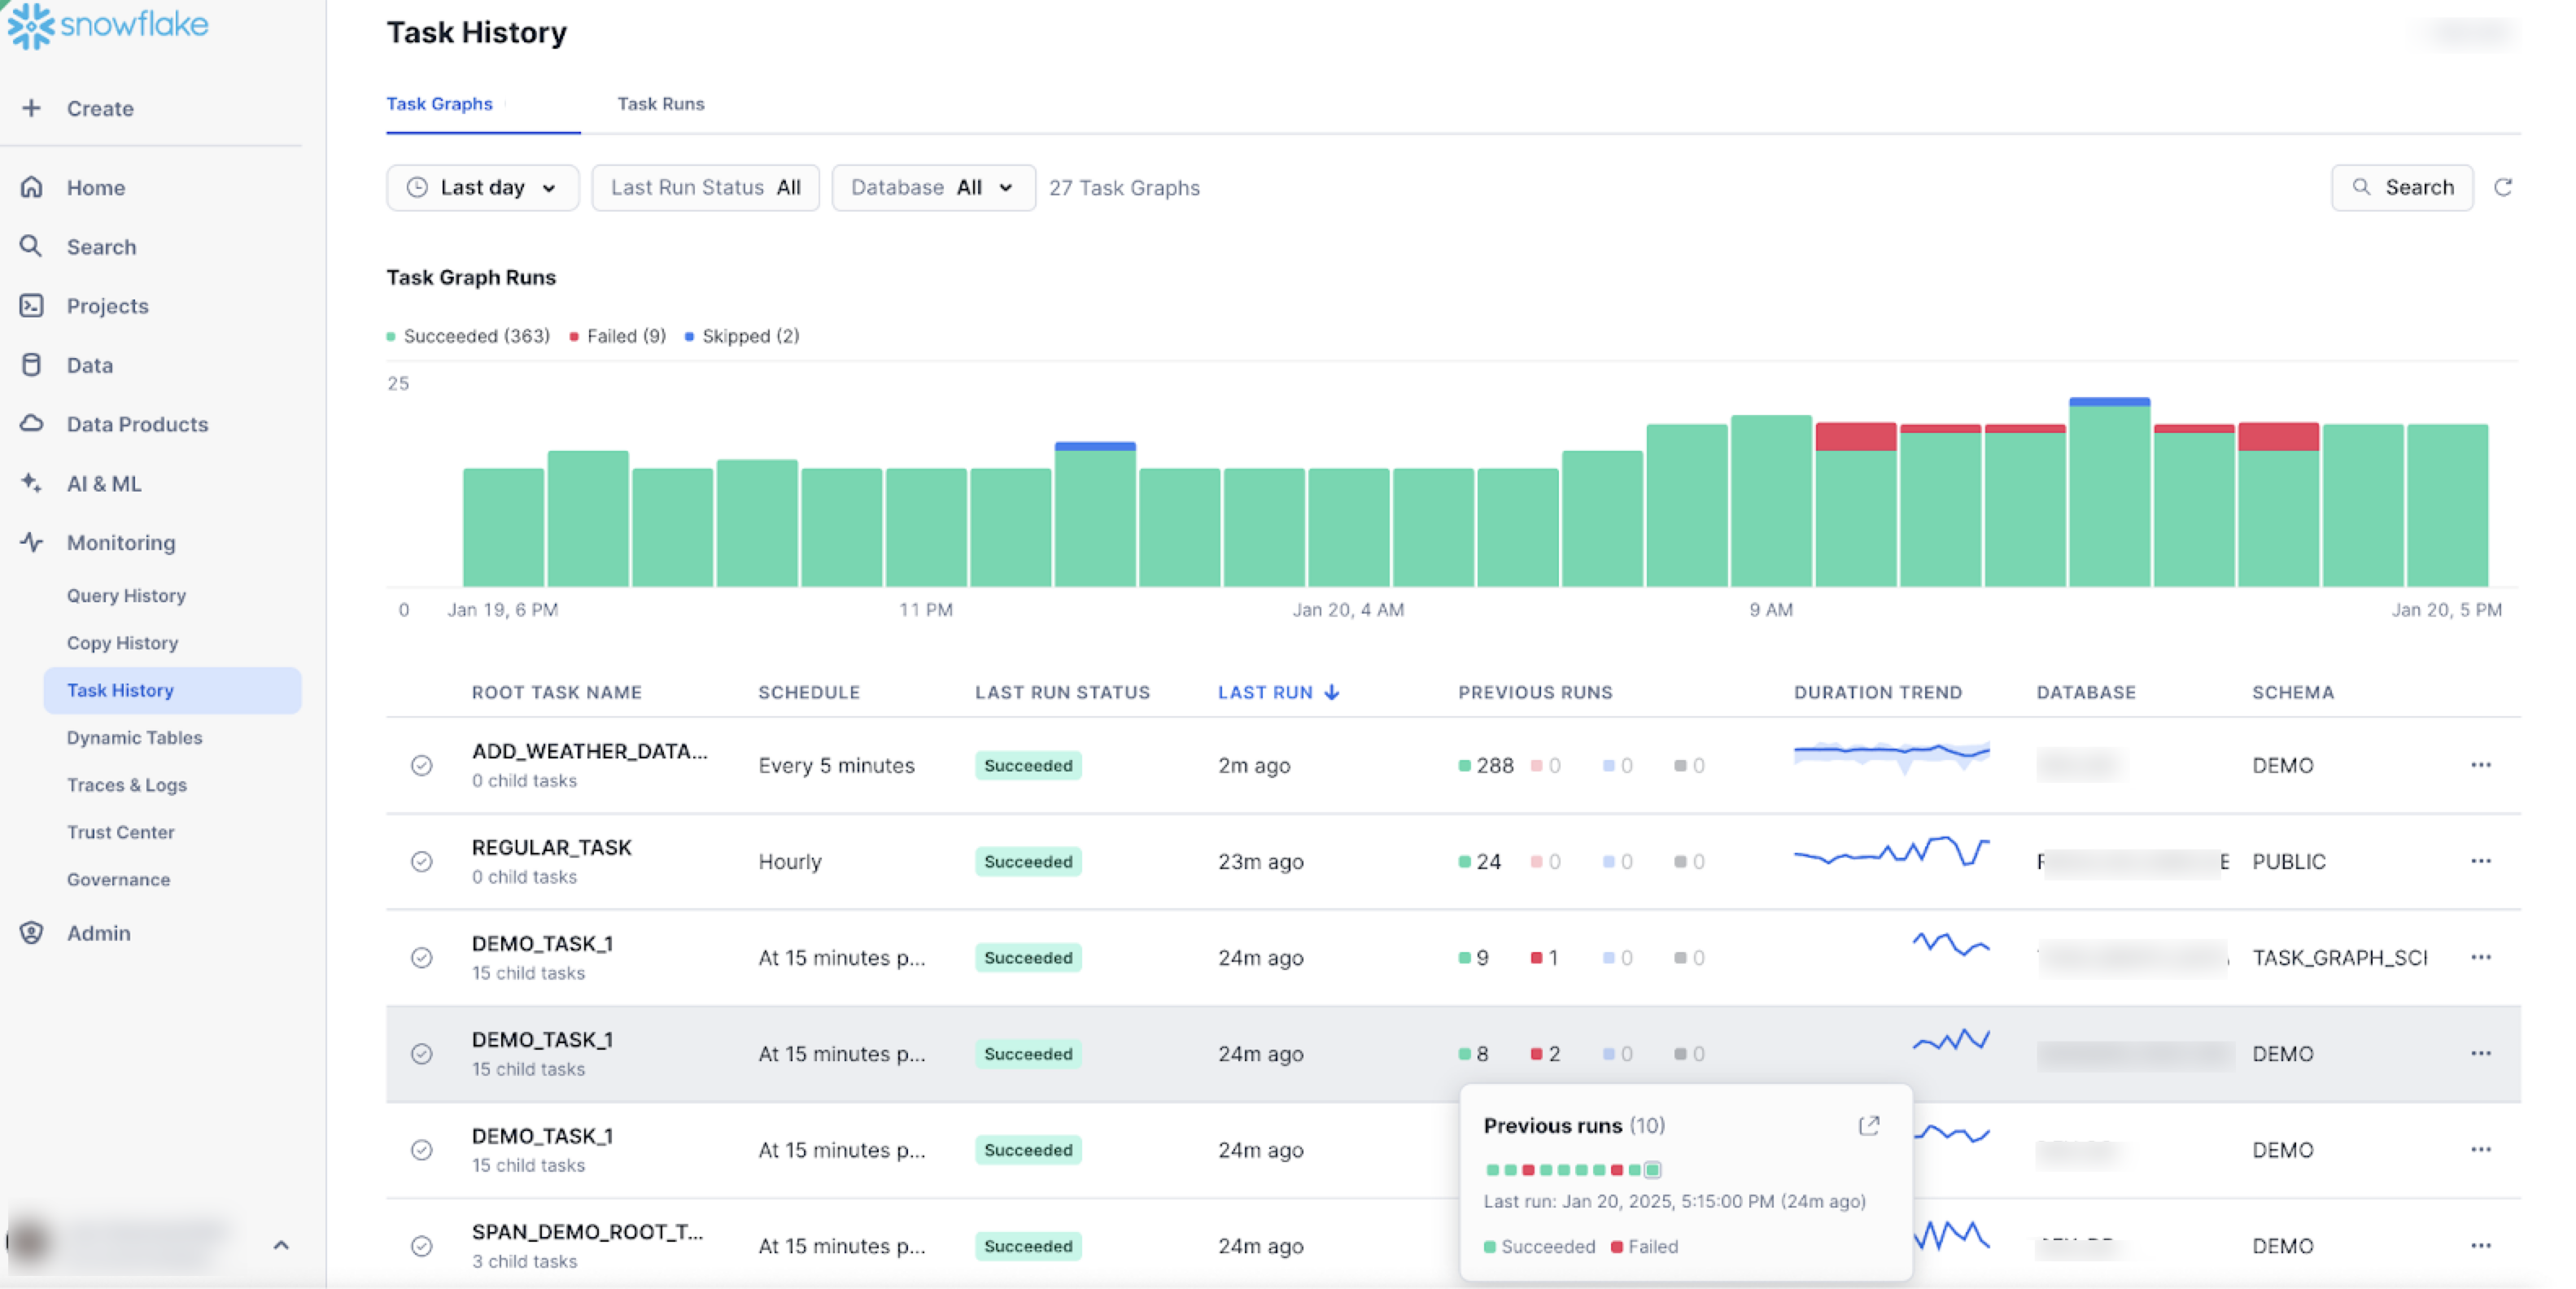
On the Task Graphs tab, you can perform the following:
- Hover over the Previous Runs counter to display the status of the most recent runs in chronological order.
- The Duration Trend graph visualizes task run durations over time (based on the selected date range) by highlighting a median line within a min-max range. This can help you quickly assess whether task durations are stable, fluctuating, or trending, and identify individual outliers.
- Use the ellipsis menu to manually run the graph, edit the root task (for example, modify the schedule or parameters), or suspend/resume the graph.
You can filter the page to display relevant information. It is recommended to filter by database and schema to reduce load times on large accounts.
- Select the Date Range filter to show task history from the last 7 days (the default setting). You can change it to 1 day. Note that the date range filter only applies to the previous runs counter and the runtime duration trends.
- Select the Last Run Status filter to display task graphs for one or more statuses, such as Succeeded, Failed, Canceled, or Skipped on the most recent run. This filter applies only to the latest completed run of a task graph.
- Filter on the name of the database or schema that contains the tasks.
- Use the search field to filter on the root task name.
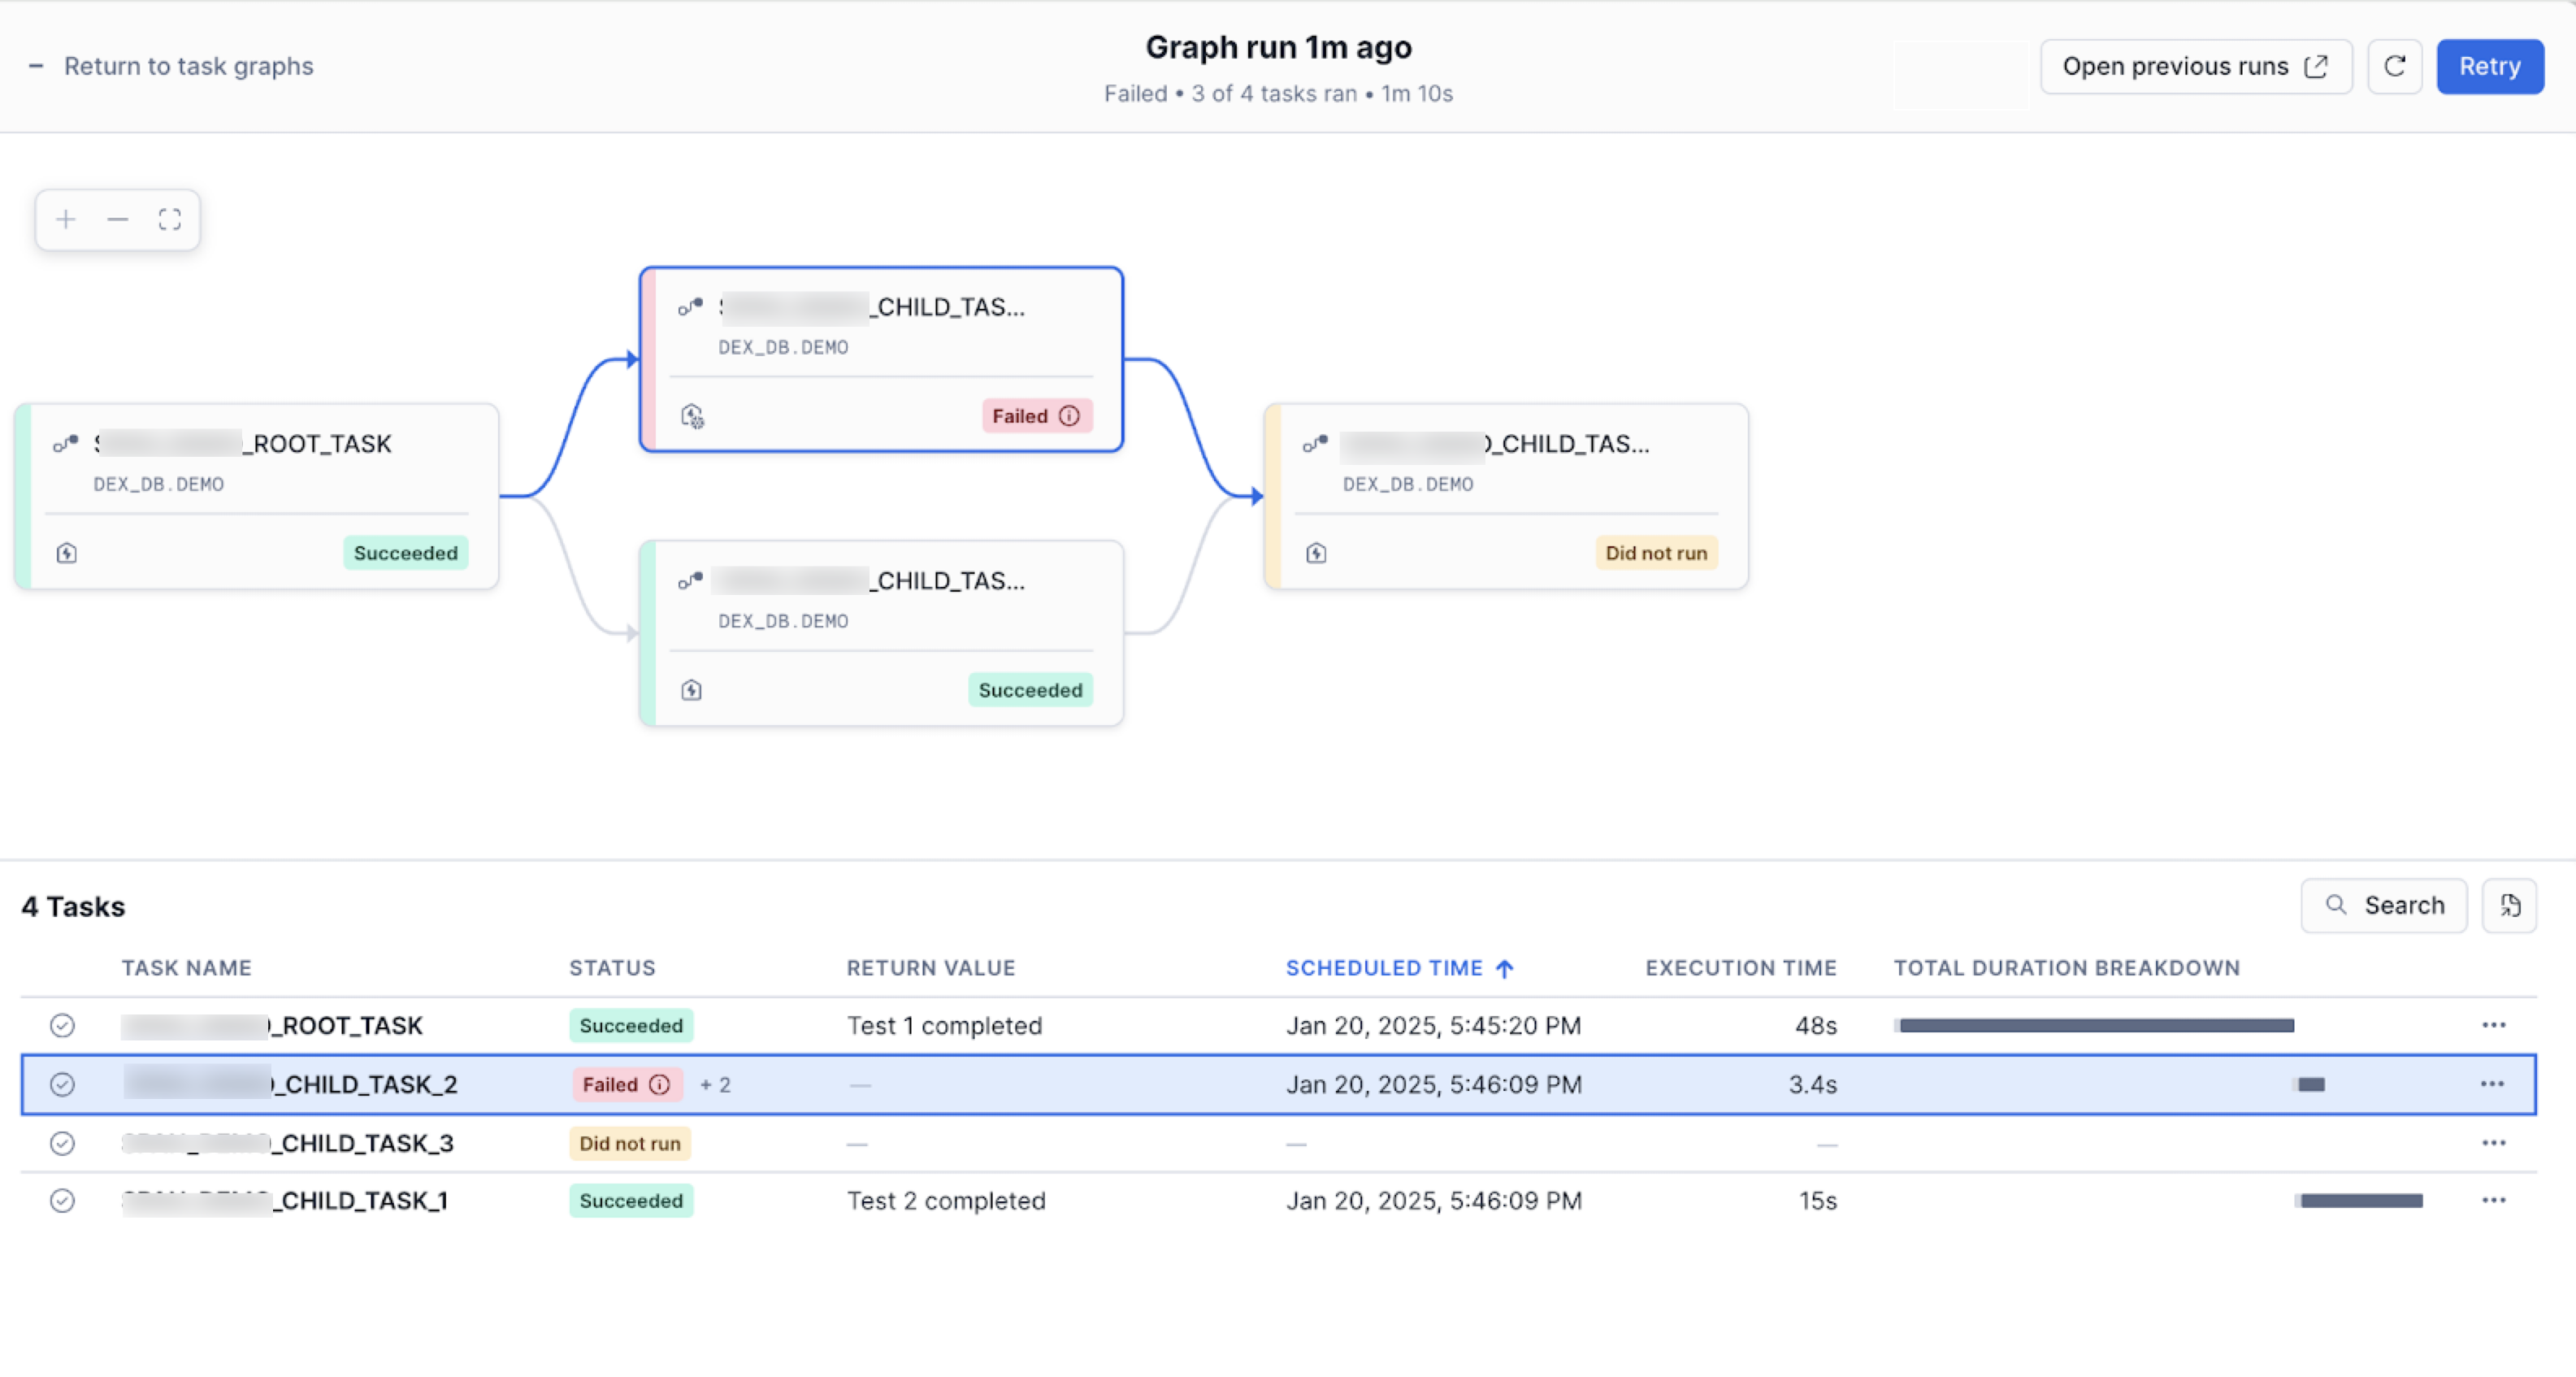
You can also select a specific task graph to drill down for more details, which the following image demonstrates:
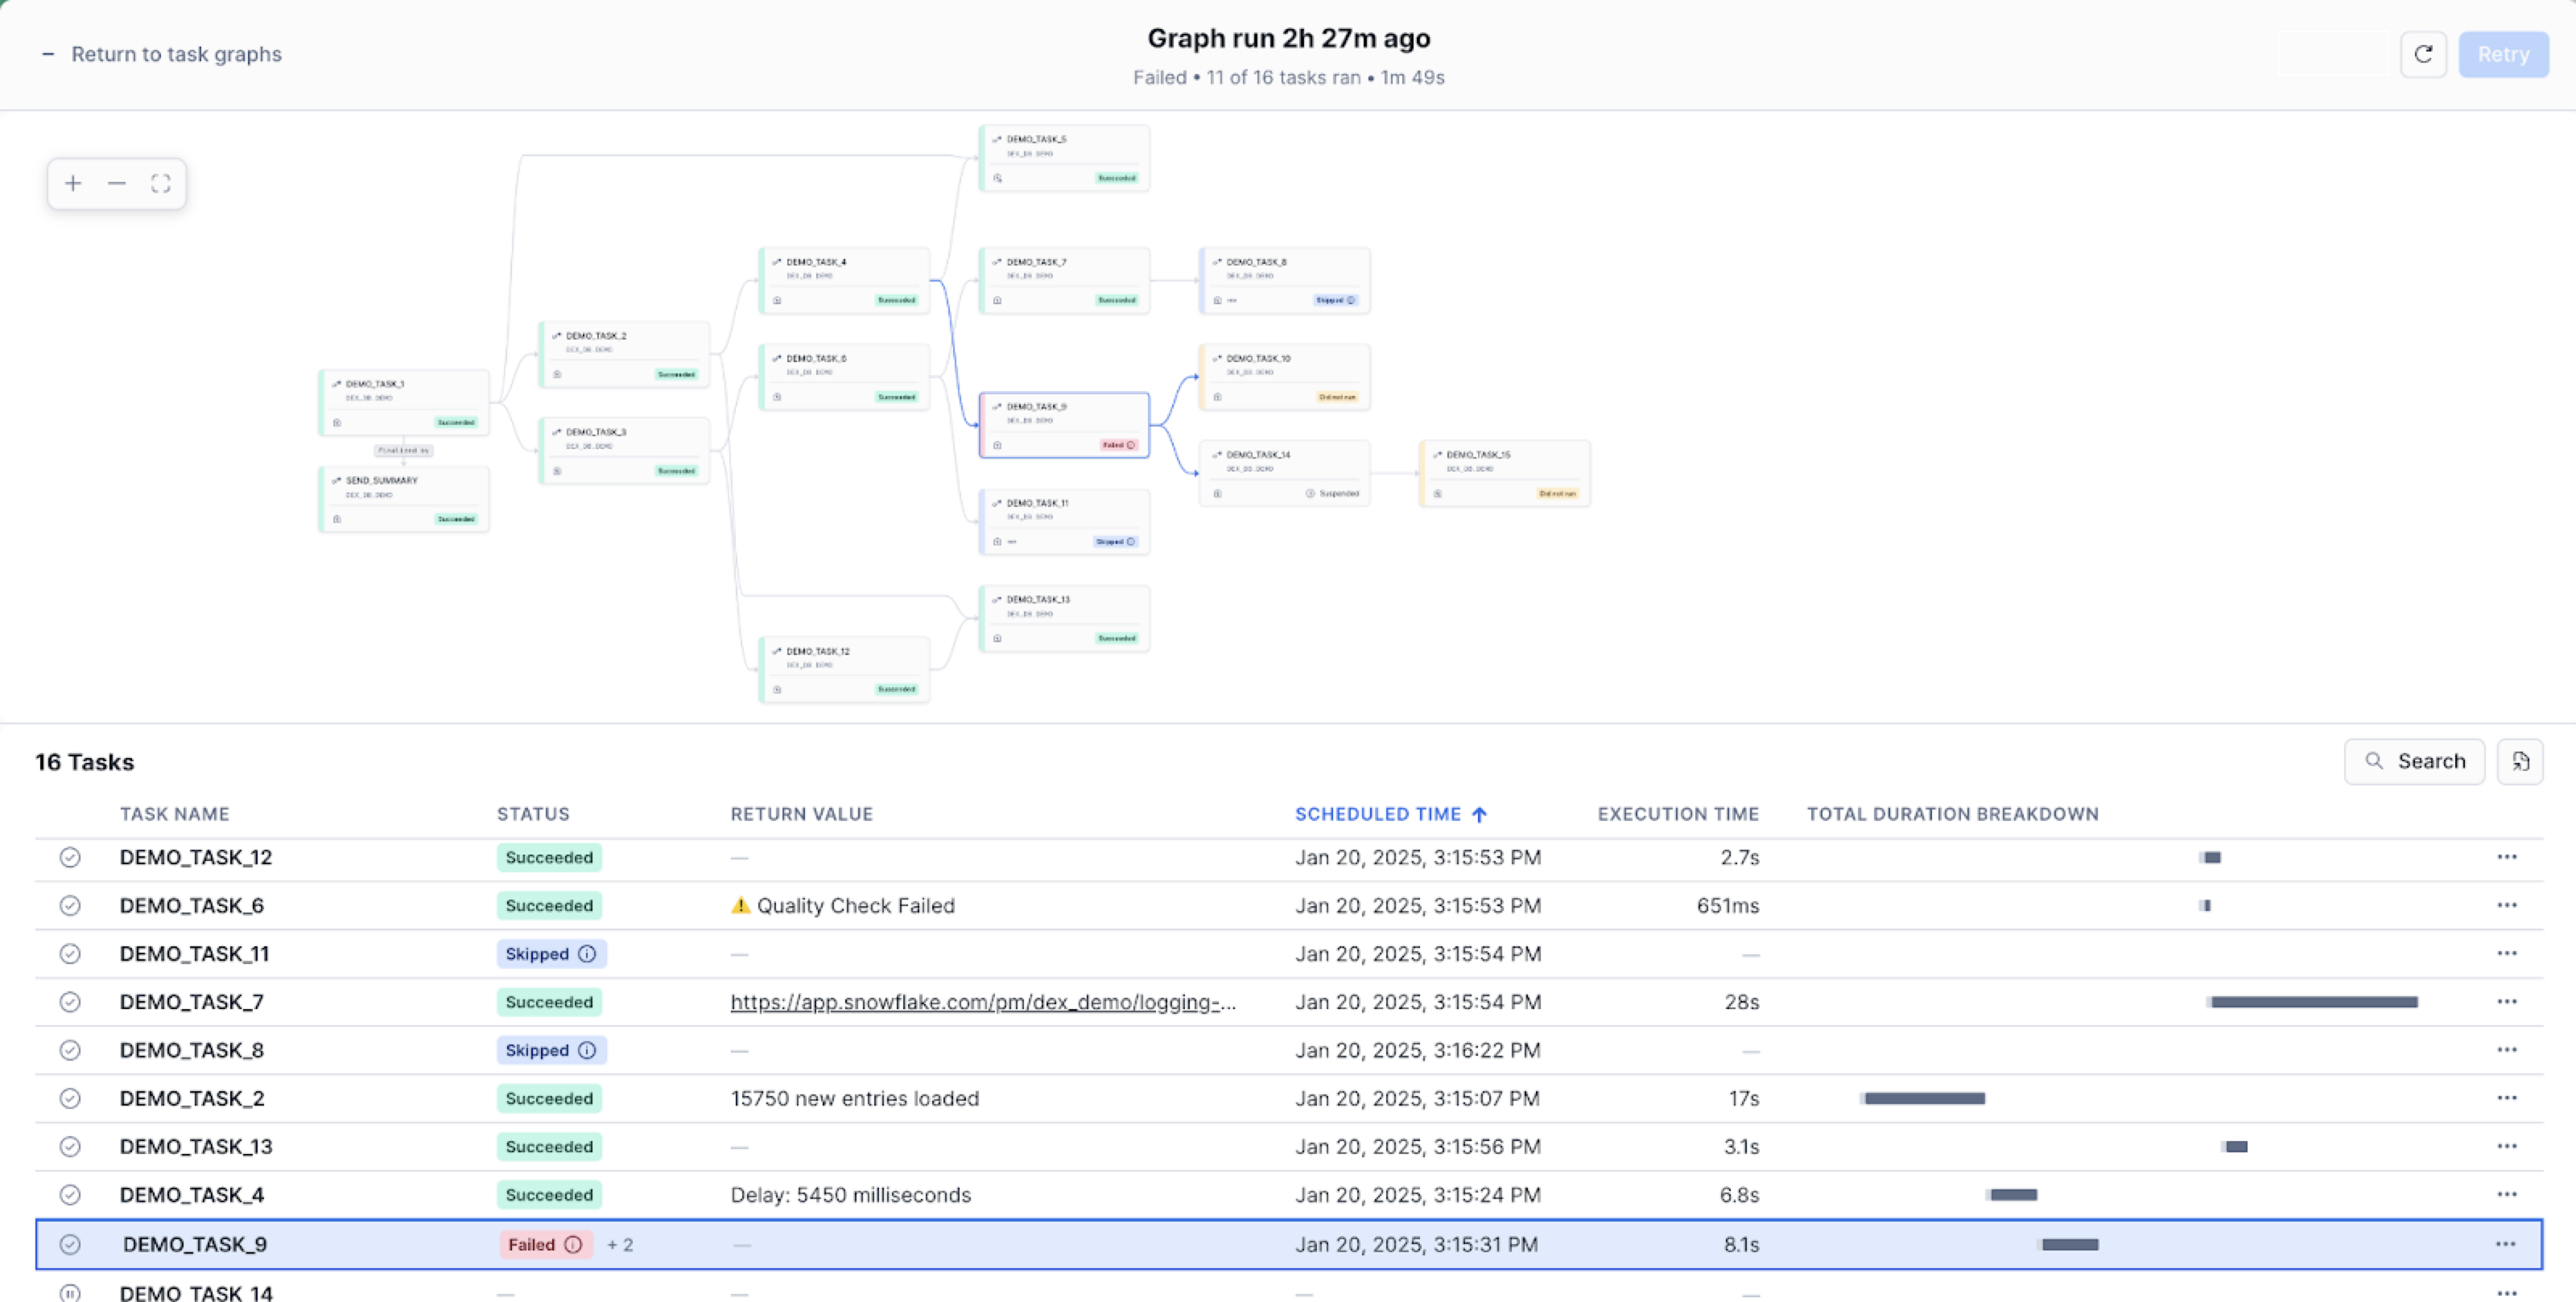
Selecting a task graph always opens the details of the most recent run. If you want to see details of a previous run, you can select Open previous runs on the specific graph run page.
Accessing task graph from a task object page
With this preview, you can also access the Task Graph page from a specific run history page if the task is part of a task graph.
-
Sign in to Snowsight.
-
In the navigation menu, select Catalog » Database Explorer.
-
In the right pane, using the object explorer, navigate to a database and schema.
-
For the selected schema, select and expand Tasks.
-
Select a task. Task information is displayed, including Task Details, Graph, and Run History sub-tabs.
-
Select the Run History tab.
-
If the task is associated with a task graph, there is a Task Graph tab next to Task, which the following image demonstrates.
Select Task Graph to view the details of the task graph.
Considerations and limitations
-
To view a task graph within this function, you’ll need a role with at least one of the following privileges:
- OWNERSHIP privilege on the task (that is, the task owner).
- MONITOR or OPERATE privileges on the task.
- The global MONITOR EXECUTION privilege.
- The ACCOUNTADMIN role.
The role must also have the USAGE privilege on the database and schema that store the task, otherwise the DATABASE_NAME and SCHEMA_NAME values in the output are NULL.
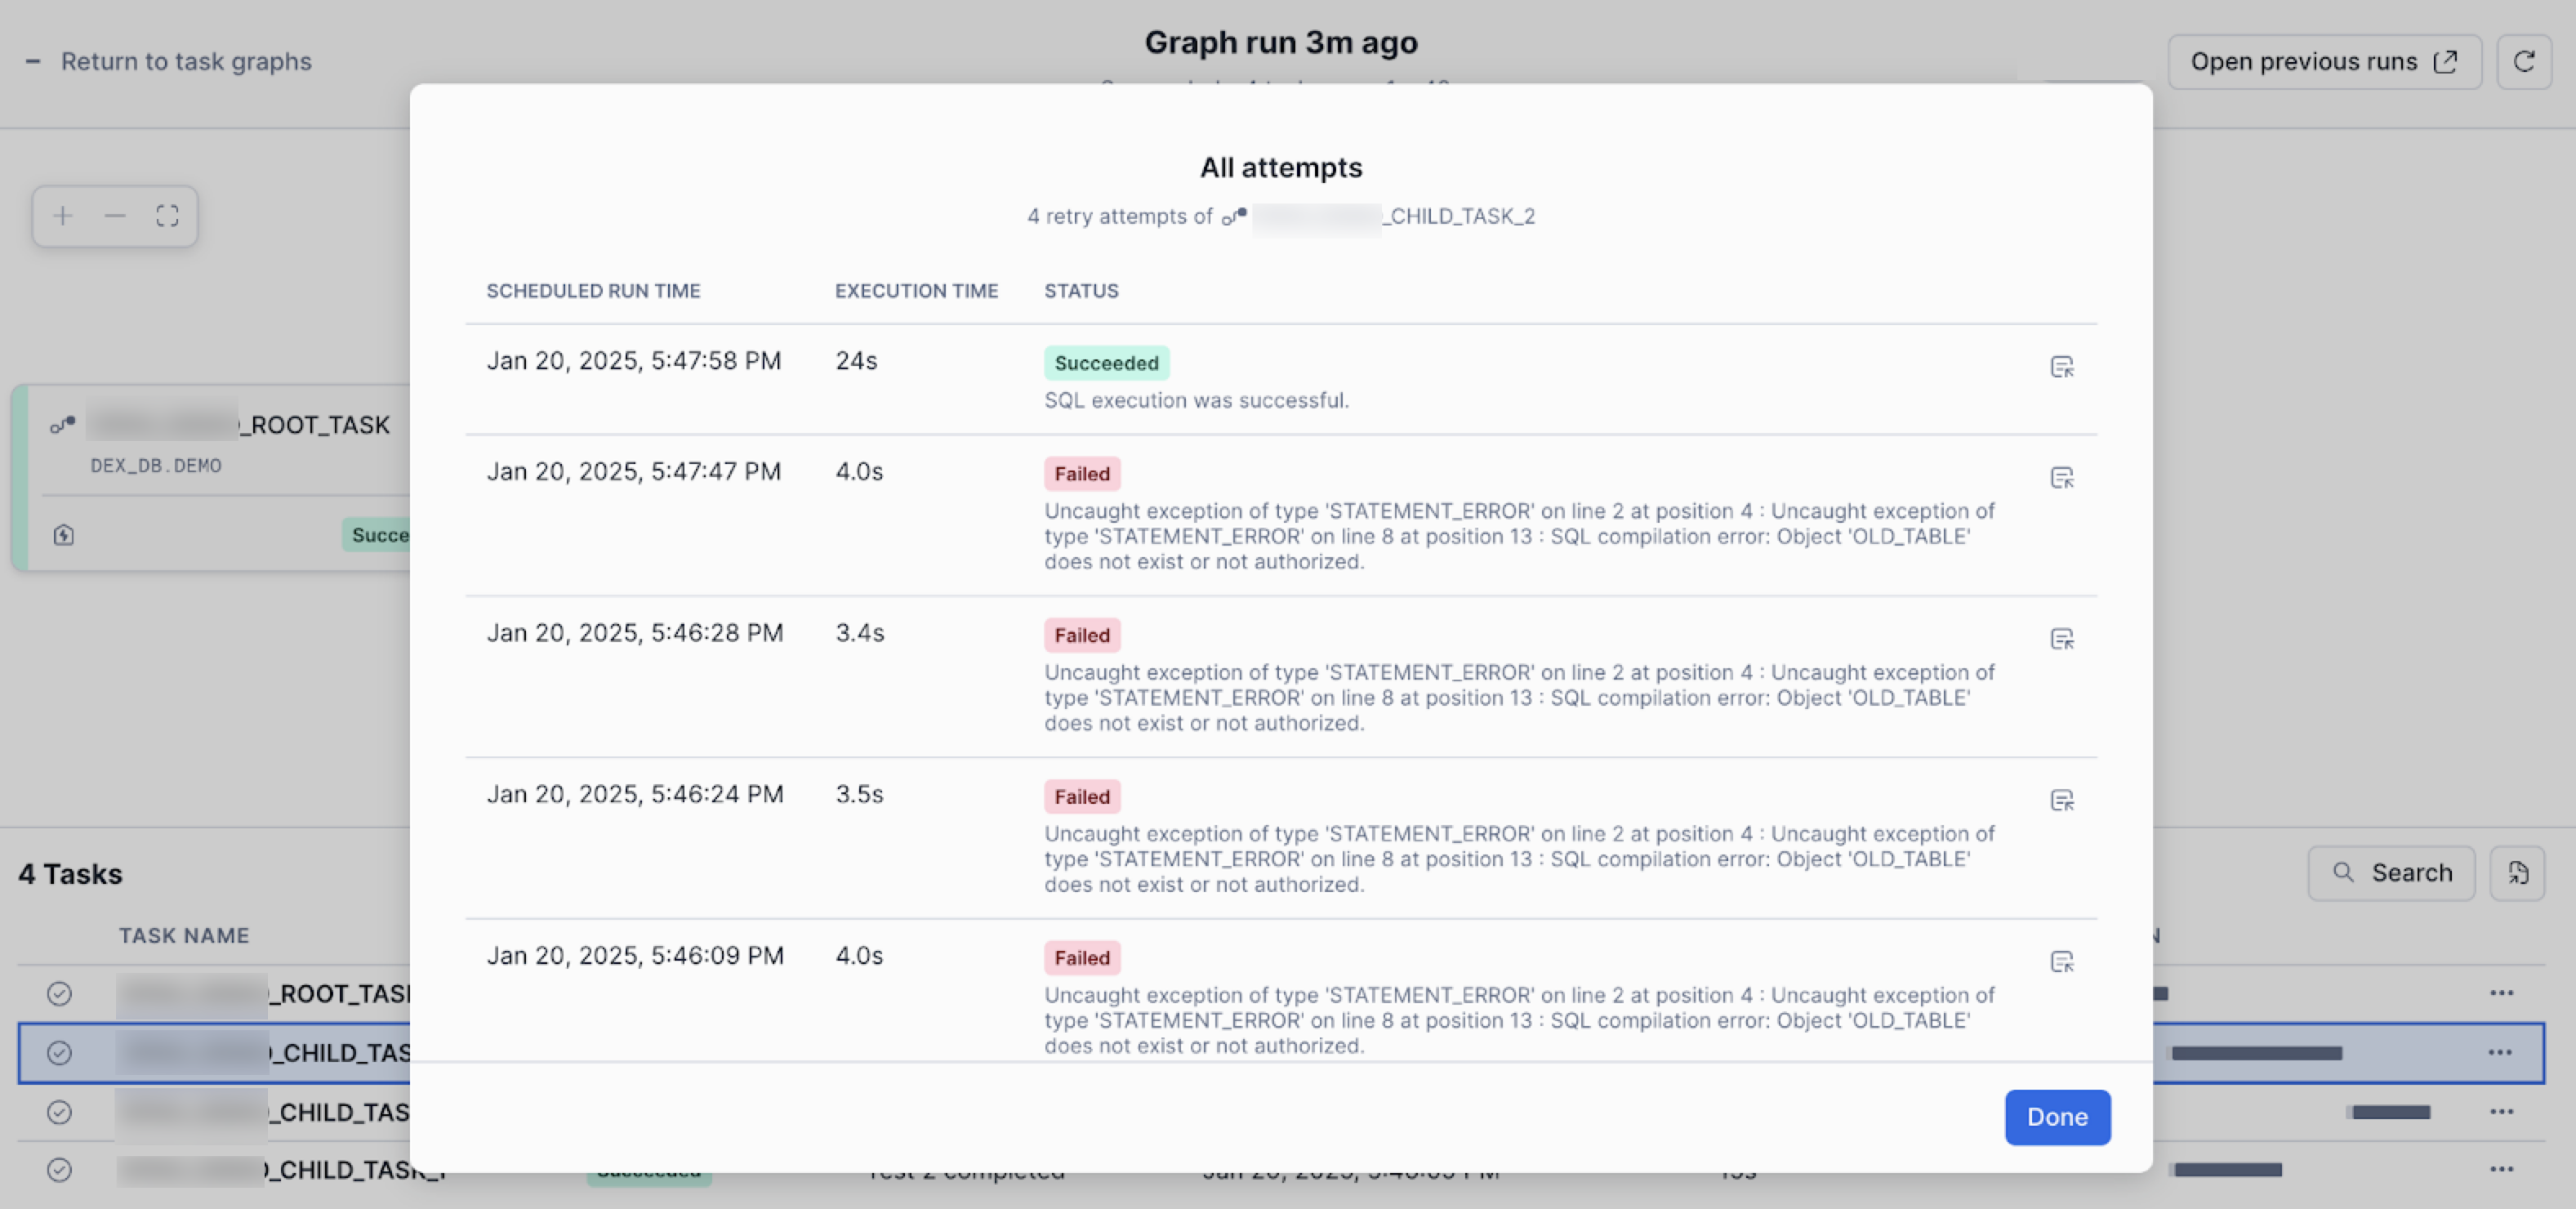
Retry failed tasks
In Snowsight, you can see previous task run attempts and retry failed and canceled task graphs. You must have the OPERATE privilege on the task to retry failed and canceled tasks. To view previous task run attempts, you also need the same privileges as viewing task history.
This is particularly useful for ensuring that data workflows or pipelines are successfully completed without having to restart the entire process, saving time and resources.
Snowflake supports both auto-retry and manual retry mechanisms:
- Auto-Retry: Tasks that fail are automatically retried shortly after failure based on predefined parameters set at the root task level.
- Manual-Retry: If auto-retry doesn’t resolve the issue, you can manually retry failed or canceled tasks within 14 days of their latest graph runs.
Using retry attempts instead of new runs is particularly helpful for completing graphs that failed partway without re-executing tasks that have already been successfully completed or skipped. This ensures that only the failed tasks are retried, minimizing redundancy.
Note
- A graph can only be retried if it hasn’t been recreated or altered since the last run.
- You must have the OWNERSHIP or OPERATE privilege on the task to retry failed and canceled tasks. To view previous task run attempts, you also need the same privileges as viewing task history.
Take the following steps to manually retry failed and canceled tasks. The following steps work only when the Viewing task graphs preview feature is enabled.
-
Sign in to Snowsight.
-
In the navigation menu, select Catalog » Database Explorer.
-
In the right pane, using the object explorer, navigate to a database and schema.
-
For the selected schema, select and expand Tasks.
-
Select a task. Task information is displayed, including Task Details, Graph, and Run History sub-tabs.
-
Select the Run History tab.
-
On the Run History page, select Task Graph.
-
On the task graph run details page, open a failed or canceled task graph.
-
Select Retry to manually retry the failed task graph run.
The retry starts only failed and canceled tasks in a graph and does not rerun tasks that have already succeeded.
-
Select the refresh button to refresh the page. The failed attempts show up in the account-level task graph run details. Account-level task run history and task graph run history show the status of the most recent attempt with a 45-minute latency.
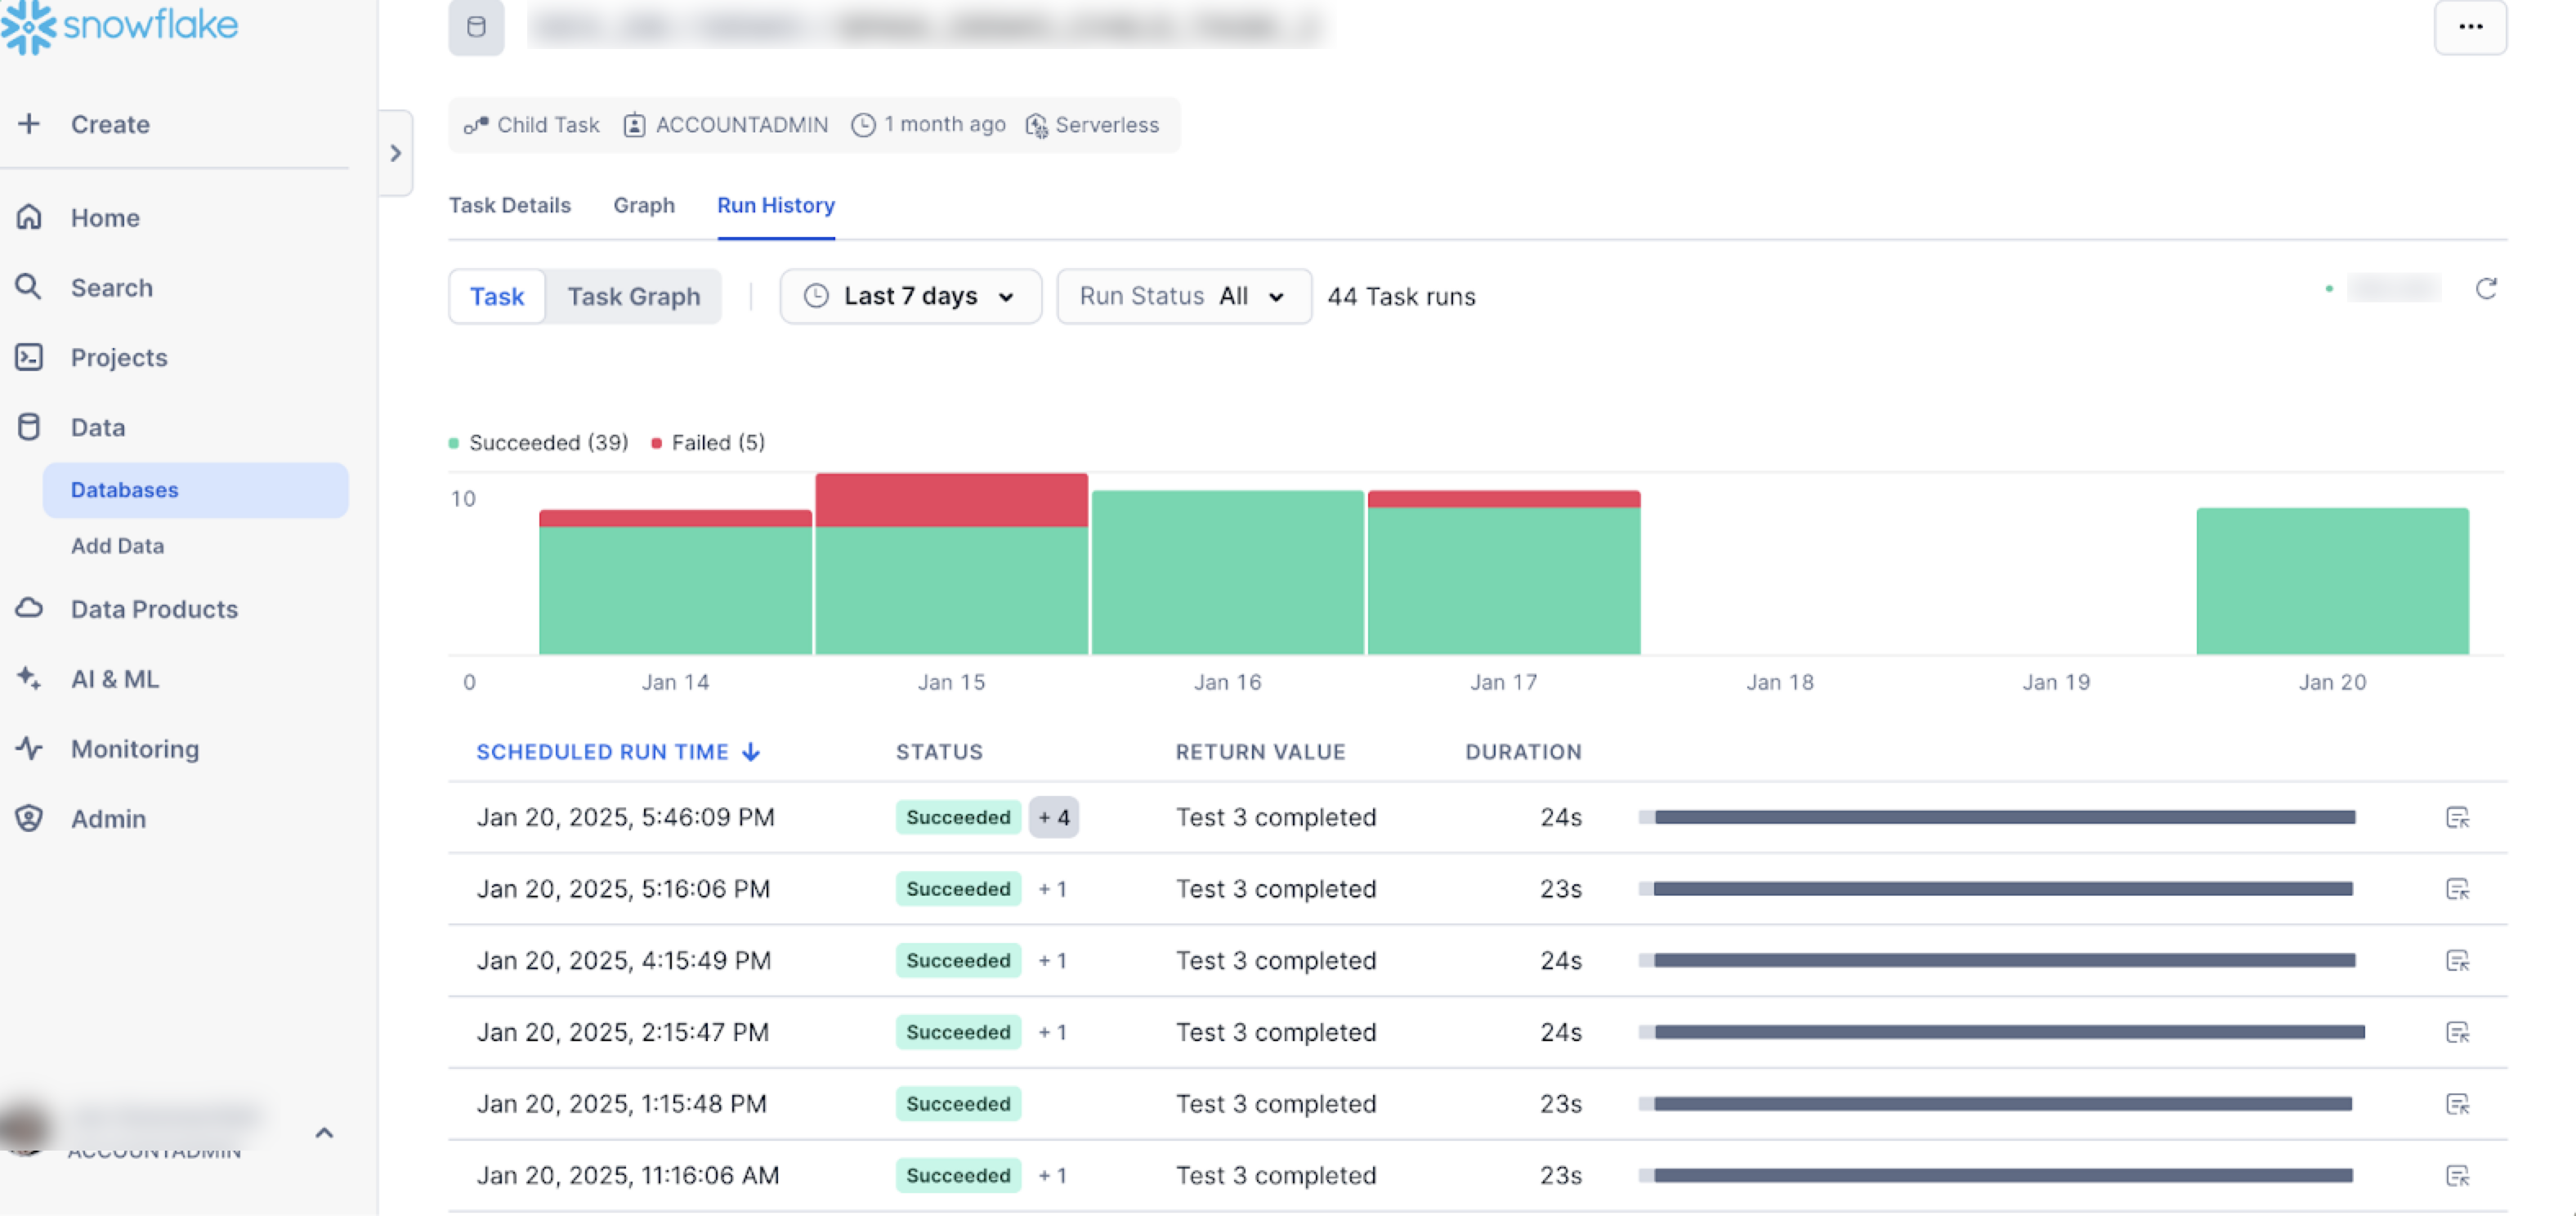
- The failed attempts also show up in the object-level task history. Follow the steps to view the run history of a task. The latest attempt for a run is shown. All attempts to run the task have the same run ID.
Any previous failed or canceled attempts are shown next to the run status. You can select the task to see the scheduled timestamp, status, and error messages for each attempt.
Note
The Retry action is disabled if any of the following is true,
- A retry is already in progress.
- The selected run is not the most recent run.
- The task graph has been modified after the run.
- The run is longer than 14 days.
The Retry action is not available if no tasks in the graph failed or were canceled.