Snowflake Dashboards
Dashboards are an AI-first business intelligence artifact in Snowflake. Analysts build multi-tile, SQL-backed dashboards conversationally with Cortex Code (CoCo) in Snowsight Workspaces, create a dashboard artifact, and share it with roles. Business users open the shared dashboard artifact in Snowflake CoWork or Snowsight and click charts to explore the data. In CoWork, they can also ask follow-up questions directly on any tile instead of filing a request for a new view.
Overview
Dashboards reimagine the dashboard as a conversational artifact native to the Snowflake platform. The product is built around four ideas:
-
AI-first creation. You describe the dashboard you want to Cortex Code, and it generates the tiles, SQL, and layout. Manual editing (drag, resize, reorder, edit SQL) is fully supported for users who prefer or require it.
-
Interactive charts. With chart actions, viewers click or drag on a chart and the rest of the dashboard responds by filtering or highlighting to match the selection.
-
Conversational consumption. Instead of pre-building a view for every persona and clicking through many filters, a viewer opens the dashboard in CoWork and asks “why did EMEA revenue drop?” as a natural-language follow-up.
-
Native governance. No separate BI license and no data extracts. Tile queries run live against your warehouse with the viewer’s own privileges (caller’s rights), and creating and sharing an artifact is gated by Snowflake RBAC.
Dashboards are authored in Snowsight Workspaces and stored as a .dash file. A dashboard
is a single artifact composed of multiple tiles; each tile is backed by a SQL query and
rendered as a chart, table, or markdown text block.
Key concepts
| Concept | Description |
|---|---|
| Dashboard | A layout, dashboard-level filters and parameters, and a set of tiles. Stored as a .dash file in a workspace. After you create an artifact and share it, viewers open that artifact in CoWork and Snowsight. The shared link opens in CoWork. |
| Tile | The unit of content on a dashboard. Each tile has a stable UUID, a SQL query, and a visualization (chart, table, or markdown). Tiles are laid out on a 12-column grid. |
| Tab | A named view within a dashboard, with its own tiles and layout. Filters and variables apply across every tab. |
| Filter | An additive row constraint the viewer applies at consumption time (for example, “Region = EMEA”). Filters are field-based and map to one or more tiles. |
| Hierarchy | An ordered set of levels, such as Region, Nation, and Customer, that viewers drill through on charts and expand in tables. See Hierarchy drill-down. |
| Chart action | An interaction the author adds to a chart. When a viewer clicks or drags on the chart, the action filters or highlights other tiles. See Chart actions. |
| Artifact creation and sharing | Creating an artifact makes a read-only copy of a .dash file. Sharing controls who can open it. Later changes to the file can be published to the artifact. See Artifact creation and sharing. |
Creating a dashboard
Dashboards are created in Snowsight Workspaces. There are two supported paths. To start from a dashboard you already built in another BI tool, see Migrating dashboards from third-party BI tools.
Create with Cortex Code (AI-first)
-
In Workspaces, choose Create > Dashboard, or ask Cortex Code to build one using the
/dashboardskill. -
Describe the dashboard in natural language (for example, “a sales overview with a revenue scorecard, monthly trend, and a top-accounts table”), and name the semantic view in your prompt if you want to use a specific one. Otherwise, CoCo can help you find the right data source, including a relevant semantic view, and construct the tile SQL.
-
CoCo generates the
.dashfile and opens it. Review the generated tiles and iterate conversationally (“change the trend to weekly”, “add a region filter”).
Create manually
Dashboards can also be built entirely by hand. You can manually create a dashboard, add tiles, write or edit tile SQL, choose a chart type, and add filters without invoking Cortex Code.
Tiles and layout
Tiles are arranged on a 12-column responsive grid. Tiles have a minimum width of 3 columns and minimum height of 2 rows to avoid unusable layouts (markdown tiles allow a minimum height of 1 row). There are three tile types:
| Type | Use |
|---|---|
chart | Vega-Lite visualizations, including scorecards. Covers the full range of chart types described below. |
table | Tabular results rendered with the shared results viewer. Supports sorting, column resizing, and pagination. |
markdown | Static text and annotations authored in Markdown. Useful for section headers, callouts, and narrative context. |
Each tile stores a stable UUID (separate from its human-readable name) so that layout positions remain valid across edits.
Chart types
Chart tiles are powered by Vega-Lite. The full Vega-Lite chart vocabulary is available, with one exception: geospatial map chart types are not supported in private preview.
The tile editor includes point-and-click controls for the most commonly used chart types. You can switch between these chart types and adjust their key settings (axes, color encoding, aggregation) directly in the editor panel without writing code:
- Bar chart (vertical and horizontal, including stacked and normalized variants)
- Line chart
- Area chart (including stacked and normalized variants)
- Pie and donut chart
- Heatmap
- Scorecard (KPI number with optional delta and sparkline)
For chart types beyond these, such as scatter plots, bubble charts, candlestick charts, strip plots, waterfall/bridge charts, and trellis layouts, describe what you want to Cortex Code. CoCo can create and edit most Vega-Lite chart types from a plain-language description (for example: “change this to a scatter plot with ORDER_VALUE on Y and CUSTOMER_SEGMENT as color”).
Tip
Asking CoCo to generate a complex or custom chart type is often faster than configuring it by hand. CoCo can also iterate on an existing chart. For example, “add a reference line at the target value” or “switch the color scale to use the Snowflake brand palette”.
Tabs
Tabs divide a dashboard into separate views that share one set of filters. Viewers can move between tabs without opening another dashboard or losing the filter selections they already made.
Each tab has its own tiles and layout. Filters and variables are defined on the dashboard, and a selection stays applied when you switch tabs.
Editing tabs
In Workspaces, select Add tab in the tab bar. Open a tab’s options menu to rename or delete it, and drag tabs to change their order. To move a tile to another tab, open the tile’s menu and select Move to tab. A dashboard can contain up to 20 tabs.
You can also ask Cortex Code to add, rename, reorder, and remove tabs, and to set the default tab, which is the tab the dashboard opens on. If you don’t set a default tab, the dashboard opens on the first tab.
Tip
When you ask CoCo to create a dashboard, you can include the tabs in the request (for example, “Build a sales dashboard with Overview, Regional, and Product tabs”).
Viewing tabs
The tab bar is shown in Workspaces, CoWork, and Snowsight. The open tab is stored in the dashboard URL, so a link you copy opens on that tab. Tile queries run only for the tab you are viewing. Switching tabs runs the queries for the tab you open.
Creating a dashboard artifact includes all of its tabs. Later changes to the file can be published to that artifact.
Filters
Dashboard filters let viewers slice data without the analyst having to pre-build a separate dashboard for each audience. The author defines filters once when building the dashboard; viewers then use those filters to focus on what matters to them. Every viewer’s filter selections are independent. Changing a filter only affects your own view, never anyone else’s.
Filters work by modifying the tile’s SQL query before it runs, so the numbers you see are always correctly aggregated for the filter you applied. For example, filtering to “EMEA only” gives you the true EMEA total, not a slice of a pre-computed global total.
When a filter has no selection, it has no effect, and the tile shows all data. Removing a filter selection can never reduce the number of rows returned; it can only add them back.
Filter template syntax
To connect a tile’s SQL to a dashboard filter, add the placeholder {{ filter('name') }}
directly in the SQL where you want the filter condition to appear:
When a viewer picks a value, the placeholder is replaced with the corresponding SQL condition before the query is sent to Snowflake. When no value is selected, the placeholder is replaced with a condition that matches everything, so the tile still loads normally.
Note
Filter values are never inserted directly into the SQL text. Snowflake treats each value as a separate query parameter, which prevents SQL injection regardless of what a viewer types or selects.
How a tile connects to a filter
A tile is connected to a filter automatically as soon as its SQL contains the matching
{{ filter('name') }} placeholder. No other configuration is required. The filter panel
in Workspaces highlights which tiles are affected when you hover over a filter.
Tip
In the filter editor, click Copy filter code to copy the exact {{ filter('name') }}
snippet for that filter. Paste it directly into your tile SQL.
Note
In private preview, the filter matches against the column name specified in the filter definition. If a column name is ambiguous across joined tables, use a SQL alias in your tile query to give the column an unambiguous name that matches the filter definition.
Filter naming rules
- Filter names must be unique within a dashboard.
- Use letters, numbers, and underscores only.
- Names are case-sensitive.
{{ filter('Region') }}and{{ filter('region') }}are different filters. - The name inside
{{ filter('...') }}must exactly match the key used in the dashboard’s filter definition.
Filter types and operators
Filters support common field types and UI modes:
| Field type | Modes | Supported operators |
|---|---|---|
string | multi-select, single-select | Equality.In, Equality.notIn, Equality.equals, Equality.notEquals |
number | single-select, range | Equality.equals, Range.between, Range.greaterThanOrEqual, Range.lessThanOrEqual |
timestamp | date range, relative | Range.between; relative tokens such as last_30_days are resolved to a concrete date range at load time (not frozen at selection) |
boolean | single-select | Equality.equals |
| any | all modes | Null.isNull, Null.isNotNull |
The default operator is derived from the filter mode: multi_select → Equality.In,
single_select → Equality.equals, range → Range.between. Relative date tokens such
as last_30_days and last_7_days stay current. They resolve to the actual date range
each time the dashboard loads, not when the filter was first set.
Filter option sources
Dropdown values for a filter come from one of three sources:
| Source | Behavior |
|---|---|
static | The author lists values inline. No query needed. |
column | Snowflake runs SELECT DISTINCT on the bound column. |
query | A custom SQL query supplies the values (for joins or transformations that a single column cannot express). |
Filter value loading and performance
For column-backed and query-backed filters, Snowflake uses the viewer’s own credentials (caller’s rights) to decide which dropdown values that viewer can see. After the values have been loaded, a prefetch cache can show the dropdown without rerunning that SQL on every click. This is not a scheduled cache shared across viewers. Viewers only see options for data they are authorized to query.
Cascading filters
Cascading filters group a hierarchy of dropdowns into one control in the filter bar. Choosing a value narrows the dropdowns below it to values that occur with that choice.
How levels interact
| Behavior | Description |
|---|---|
| Multi-select | Every level is a multi-select dropdown. Choosing several values at a level includes the matching values at the levels below. |
| Downward only | A selection narrows the levels below it. Selections do not change the options shown at higher levels. |
| Empty levels | A level with no selection has no effect, the same as any other filter. The levels below it list every value that the selections above allow. |
| Changing a parent | Changing a level clears every level below it. If any of those levels has a selection, the filter bar asks you to confirm before clearing them. Don’t show anymore hides that prompt until you reload the page. |
| Other filters | The values in a cascading filter can also depend on the dashboard’s other filters. For example, a date range on the same dashboard can restrict every level to values inside that range. |
Creating a cascading filter
Cascading filters are created with Cortex Code. Describe a hierarchy of 2 to 10 levels, and CoCo defines the levels, writes the query that lists the values, and connects the filter to the relevant tiles.
To add a level, reorder levels, or change the query that supplies the values, ask CoCo. These changes aren’t available in the filter editor.
Connecting tiles to a cascading filter
Connect a tile by adding the placeholder {{ filter('name') }} to its SQL, the same way
you connect any other filter. One placeholder applies every level of the cascading filter:
Each level filters on its own column, so the tile’s query needs a column for every level.
In the query above, those columns are REGION, COUNTRY, and CITY.
Note
Values within a level must be unique. Two cities with the same name appear as one option unless the values at that level distinguish them.
Hierarchy drill-down
A hierarchy is an ordered set of levels in your data, such as Region, Nation, and Customer, or Year, Quarter, and Month. It is separate from a chart action. A chart action filters or highlights other tiles. A hierarchy changes the chart or table the viewer clicked, moving through levels defined on the dashboard.
Viewers move through the levels without leaving the dashboard:
- On a bar chart or a pie chart, select a bar or a slice to drill down into it. A level trail above the chart shows the current level and the members you drilled into. Select a level in the trail to drill back up or jump to that level.
- In a hierarchy table, expand a row to show the next level under it. You can expand rows at different levels at the same time.
Each level runs as its own query against the source rows, so totals are correct at every level, including distinct counts. Drilling changes only your own view.
Defining a hierarchy
Hierarchies are defined on the dashboard, next to filters. Each hierarchy lists its levels from the top level down, and needs at least two levels. Each level has:
| Field | Description |
|---|---|
label | The level name shown in the level trail (for example, “Region”). |
key | The expression that identifies each member of the level, and its data type. |
display | The column that viewers read for each member, such as a name. |
group_by | The expressions that the tile query groups by at this level. Includes the key and display columns. |
A hierarchy can also set the level that charts open at, and the rows that tables open expanded. In Workspaces, selecting a level in a chart’s level trail sets the level that the chart opens at when you save the dashboard.
Tip
When you ask Cortex Code to create a dashboard, you can describe the hierarchy in the request (for example, “Add a revenue bar chart that drills from region to nation to customer, and a table that expands the same way”).
Hierarchy template syntax
To connect a tile’s SQL to a hierarchy, add the placeholders {{ hierarchy_key('name') }}
and {{ hierarchy_rows('name') }}:
When the query runs, {{ hierarchy_key('geo') }} is replaced with the columns of the
current level, and {{ hierarchy_rows('geo') }} is replaced with a condition that keeps
only the rows of the member the viewer drilled into. At the top level, the condition
matches everything. Filters and hierarchies work together in the same query.
Important
A query that uses {{ hierarchy_key(...) }} must also use {{ hierarchy_rows(...) }}.
Without it, drilling changes the grouping but not the rows, so the numbers are wrong even
though the query runs.
At every level, the query result includes a LEVEL_KEY column and a LEVEL_LABEL column.
Use these columns in charts and tables, so that a tile works at every level. A table
becomes a hierarchy table when it shows the LEVEL_LABEL column of a hierarchy query.
Regular SQL clauses still apply to a hierarchy query, and they apply to each level
separately. For example, ORDER BY revenue DESC LIMIT 10 shows the top 10 nations in the
region you drilled into, not the top 10 nations overall.
Choosing levels
- Key each level on an identifier and display a name. A chart places each member by its display value, so two members with the same name share one bar or slice. When names can repeat, display a unique value, such as the name followed by the ID.
- Each member must have exactly one parent in the level above. Otherwise, drilling into one parent shows rows that belong to another.
- For time hierarchies, key each level on a truncated date, such as
DATE_TRUNC('QUARTER', order_date), not on a repeating number such as a quarter number.
Chart actions
Chart actions make a dashboard interactive. Viewers click or drag on a chart, and the rest of the dashboard responds: other tiles filter to the selection, or the data that doesn’t match is dimmed. Without chart actions, each tile answers its own question. With them, a viewer can ask “which region is driving the increase in sales?”, click that region’s bar, and see every other tile update for that region.
Note
Chart actions are currently available only through Cortex Code. You can’t add them in the tile editor yet. Ask CoCo something like, “Can you connect Revenue by country so that clicking a country filters the other tiles?”
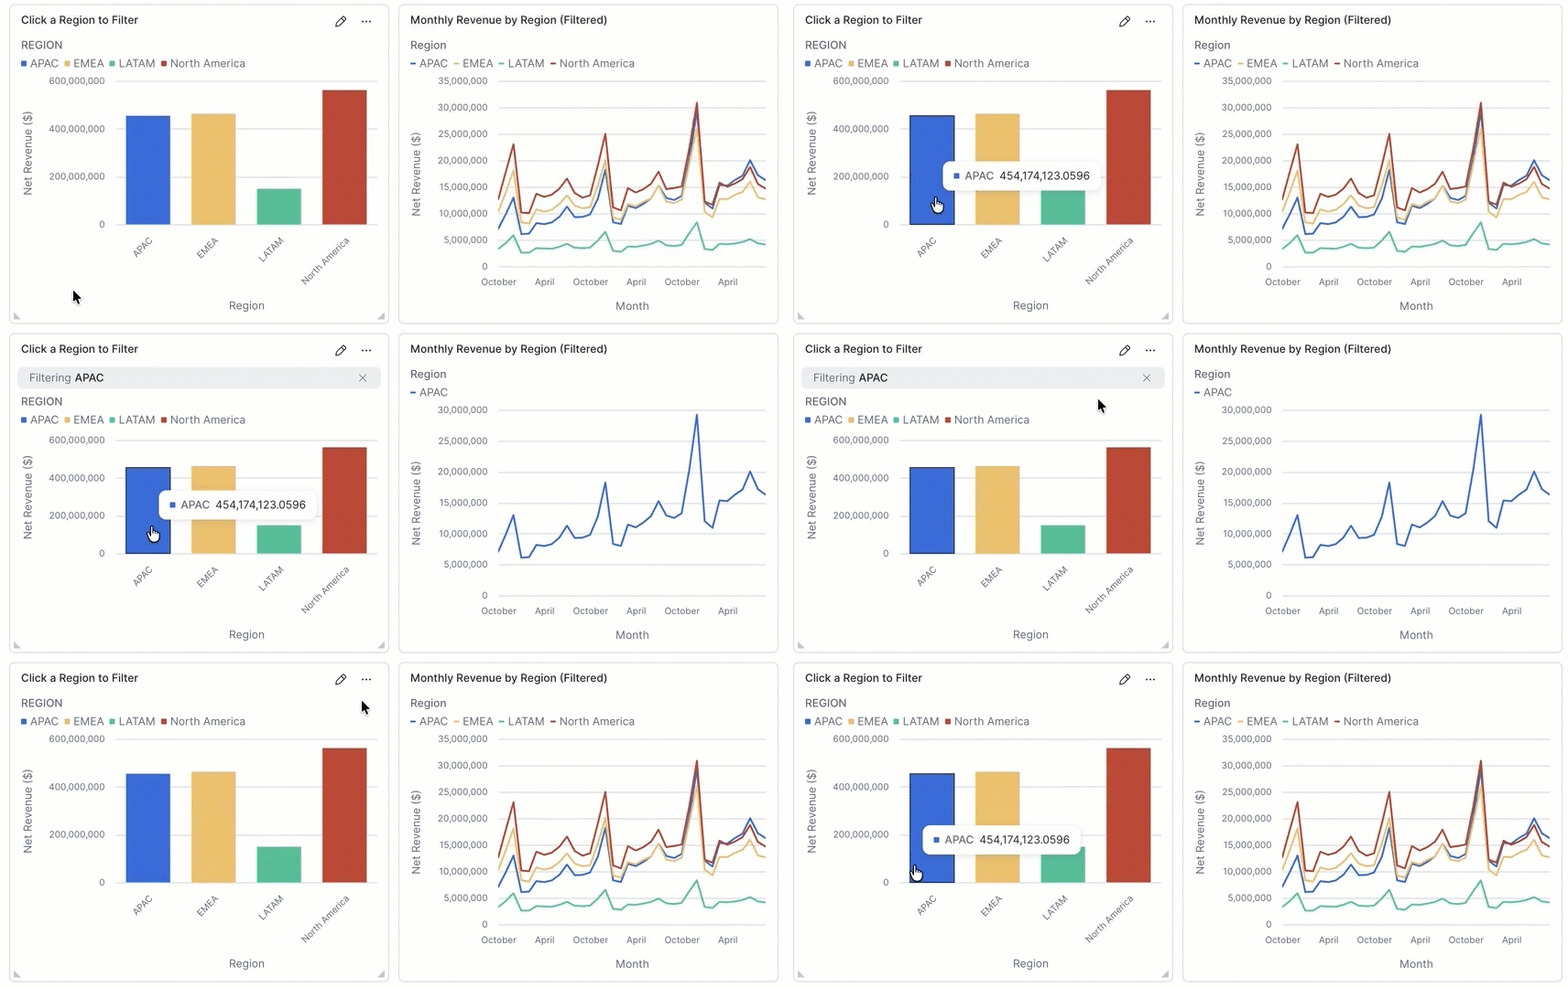
Source and target tiles
- A source tile is the tile a viewer interacts with: the chart they click or drag on.
- A target tile is a tile that responds to that interaction by filtering or highlighting.
One source tile can have many targets. A single click can update every other tile on the dashboard at once, or only the specific tiles the action targets.
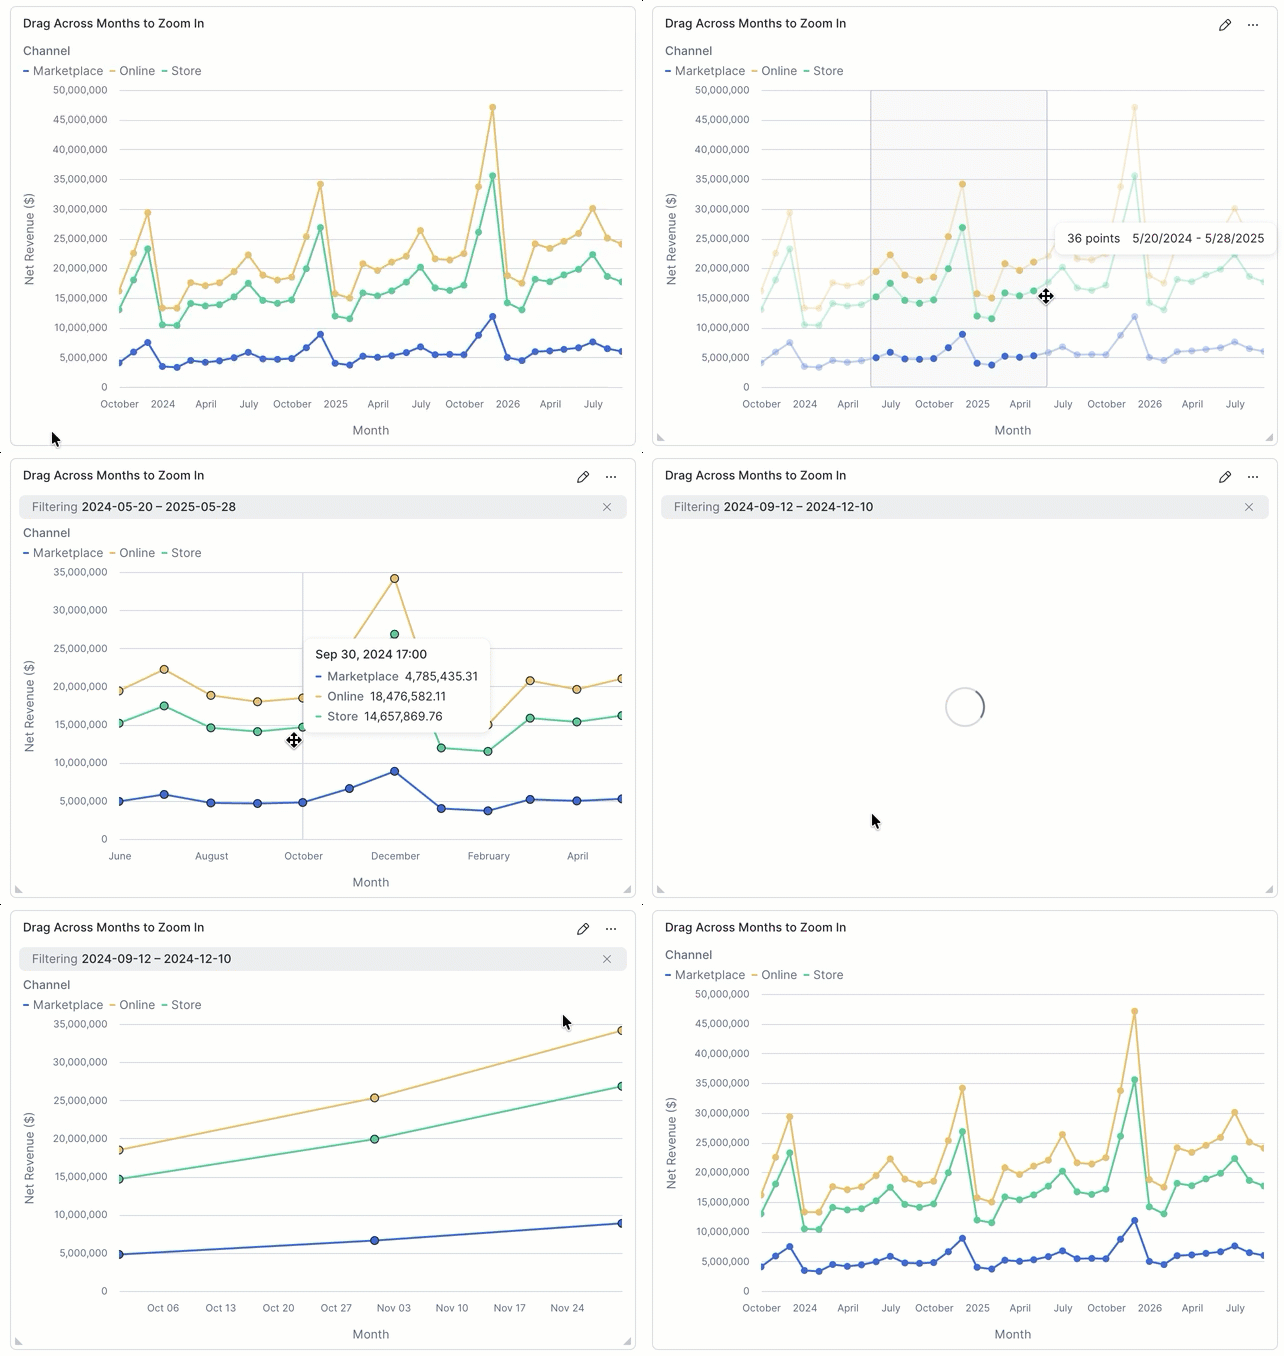
A tile can be both a source and a target, so a single click can cascade through a dashboard. A source tile can also target itself: pointing a filter action back at the source chart creates a zoom-in effect, where clicking a segment narrows that same chart to the selection.
Action types
| Action | Behavior |
|---|---|
| Filter | Removes data that doesn’t match the selection from the target tiles, then re-runs their queries. |
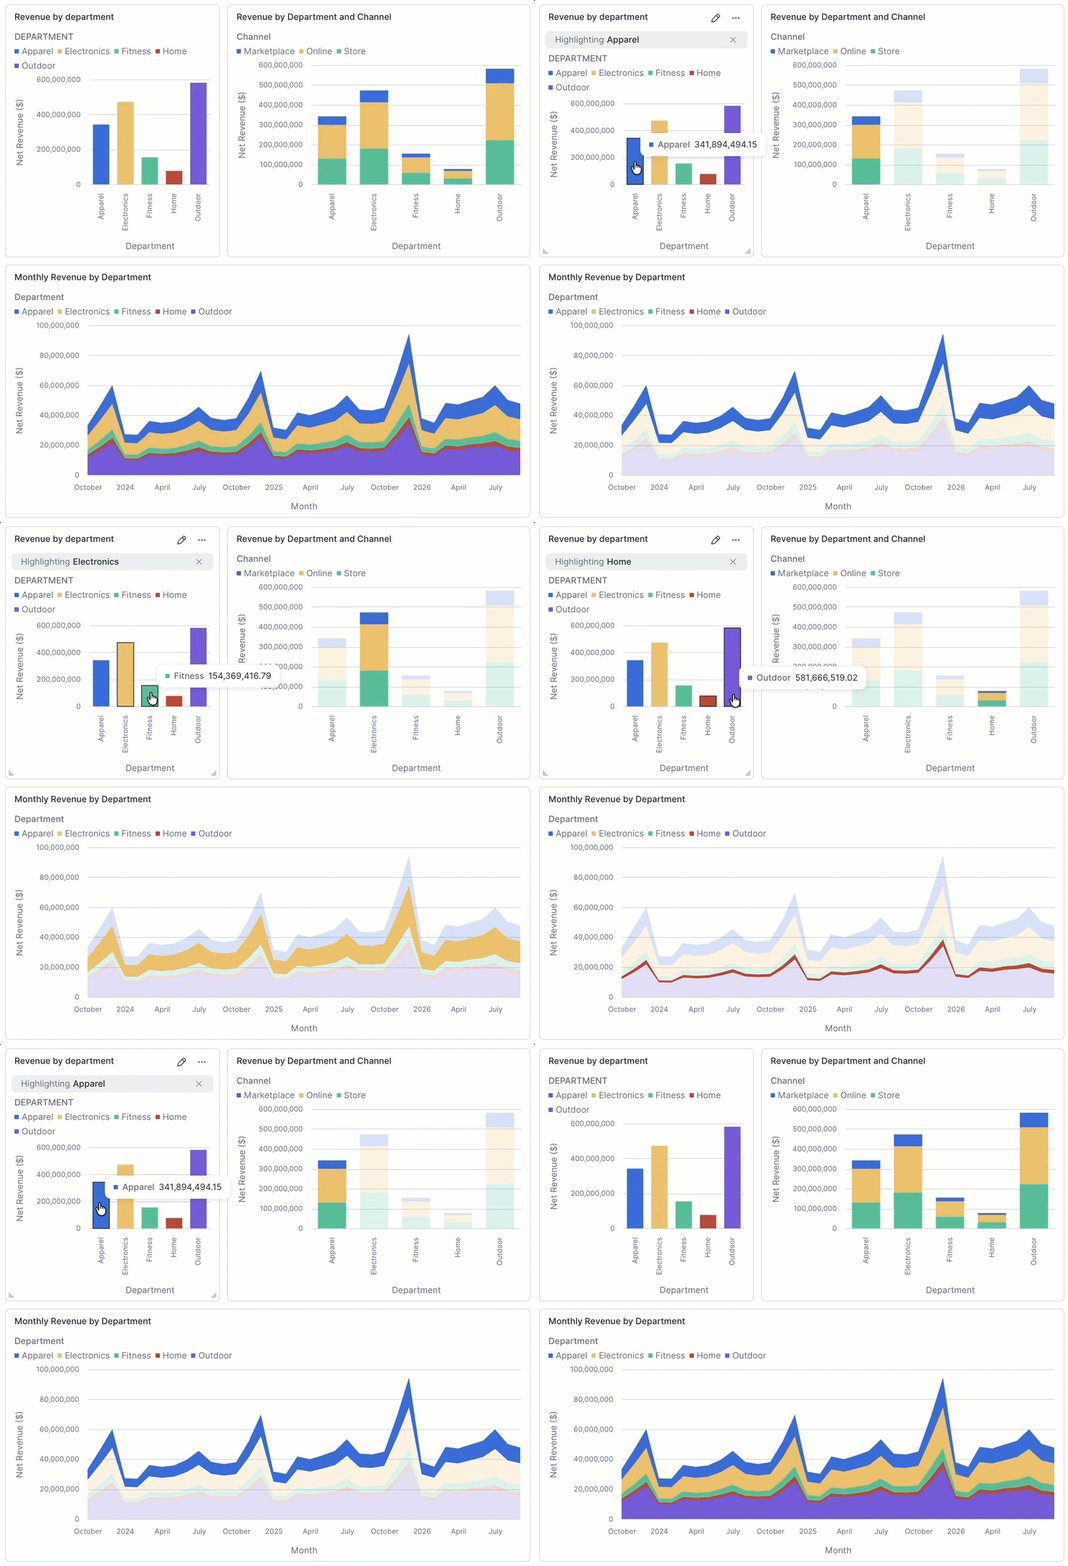
| Highlight | Keeps all data visible and dims the data that doesn’t match the selection. Queries aren’t re-run, so the change is instant. |
| Drill-down | Replaces the source chart with the next level of detail. This action is in early development. To define the levels viewers drill through, see Hierarchy drill-down. |
Filtering and highlighting answer different questions. Use a filter action when you want the other tiles to be about the selection. Use a highlight action when you want to see the selection in proportion to everything else. Drill-down is separate: it changes the source chart itself, one level at a time, and is still in early development. For the supported way to define those levels, see Hierarchy drill-down.
Which tiles can have actions
A tile can drive chart actions only when it queries the same table or view as the tiles it should affect. Cortex Code matches a column those tiles have in common, so you don’t map fields by hand. A tile written as one-off custom SQL that doesn’t query that same data can’t participate yet. If that’s why Cortex Code can’t add an action, it tells you.
Add chart actions with Cortex Code
You add chart actions by asking Cortex Code in the CoCo chat panel, in plain language. You don’t write any configuration yourself. The tiles must query the same table or view. Cortex Code matches a column those tiles have in common, so you don’t map fields by hand.
For example, suppose a dashboard has a tile named Revenue by country, a revenue trend line, and a table of open deals:
| Ask Cortex Code | Result |
|---|---|
| “When someone clicks a country in Revenue by country, filter the other tiles to it” | Clicking a bar filters the trend line and the deals table to that country. |
| “Let people drill from country down into state and city” | Clicking a bar replaces it with that country’s states; clicking again shows cities. |
| “Highlight the selection instead of filtering the other tiles” | Clicking a bar dims the data that doesn’t match instead of removing it. |
| “Only filter the deals table, not the trend line” | The trend line keeps showing all countries; only the table responds. |
| “Let people drag across the trend line to pick a date range” | Dragging selects a date range and applies it to the other tiles. |
After Cortex Code makes the change, the tile updates immediately and you can click it to check the behavior. If the result isn’t what you meant, say so in the same conversation (for example, “that should filter the table too”) instead of starting over.
Use a dashboard that has chart actions
Select data
- Click a segment to select it.
- Click the segment again to clear the selection.
- Cmd-click (macOS) or Ctrl-click (Windows) additional segments to build a multi-selection.
- Drag across a chart to select a range.
- Click empty space in the plot to clear all selections.
See which actions are applied
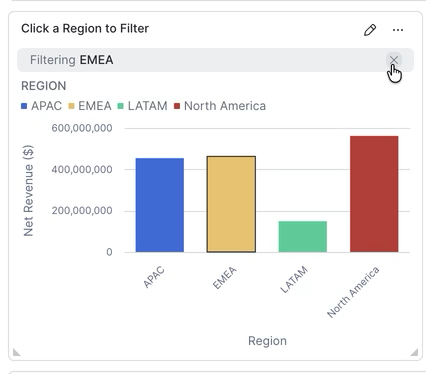
While an action is applied, the source tile shows a gray banner that names the selection, for example, Filtering EMEA. The banner shows which tile is driving the dashboard.
Clear an action
To return the dashboard to its starting state, do one of the following:
- Click the ✕ at the right end of the banner on the source tile. Target tiles return to their unfiltered state, and for a highlight action every segment returns to full opacity. The banner disappears.
- Click empty space in the plot to clear the selection.
Artifact creation and sharing
Dashboards support two distinct sharing models with different audiences and purposes.
Editing collaboration
Dashboard files (.dash) live in a Snowsight workspace. There are three workspace types:
- Private workspace: Visible only to the owner by default.
- Shared workspace: Accessible to other Snowflake users you grant view or edit permissions to via RBAC.
- Git-backed workspace: Content is version-controlled in a connected Git repository, enabling code review and branch-based approval workflows before changes are merged.
Placing a dashboard in a shared or git-backed workspace is how teams of analysts write, review, and approve changes collaboratively. This path does not require any special privilege and does not create a dashboard artifact.
Create and share a dashboard artifact
For information about creating artifacts and managing access, see
Create and share a dashboard or HTML report. Creating an artifact makes a read-only copy of the current .dash file.
Sharing controls who can open it. Later changes to the file can be published to the
artifact.
Source file linkage
Creating an artifact records the path of the .dash file and stores the artifact
identifier on that file. That record is not updated if you later delete, rename, or move
the file.
- Deleting the file leaves the artifact in place. Open source file points at a path that no longer exists.
- Renaming the file does not update the artifact. If another file later receives the original name, Open source file opens that file.
- Moving the file to another workspace, or into another folder, can remove the artifact identifier from the file. The file then looks as if no artifact has been created. Creating an artifact from it again creates a new artifact and a new link. The previous artifact stays at its existing link, and you cannot attach the file to that artifact.
Execution model: caller’s rights
Shared dashboard artifacts run with caller’s rights: each viewer’s tile queries execute using that viewer’s own data privileges. A user who lacks access to the underlying tables sees no data. This provides stronger data governance than Legacy Dashboards’ shared execution model, at the cost of per-viewer warehouse compute. A tile result can be served from that viewer’s earlier snapshot instead of rerunning the SQL.
Viewing a shared dashboard artifact
The link to a shared dashboard artifact opens in Snowflake CoWork. The same artifact also opens in Snowsight, with the same tiles, tabs, and access grants, so viewers don’t need a separate copy for each one. CoWork adds conversational follow-ups on top of the dashboard.
Ask follow-up questions in CoWork
When a user opens a dashboard in CoWork, the dashboard opens as an artifact. A chat bar hovers at the bottom of the canvas; conversations started from the dashboard appear in the left-hand chat list. Supported consumption actions:
| Action | Supported | Notes |
|---|---|---|
| Ask insight / drill-down questions | Yes | The primary use case, for example “Why is this metric down?” |
| Use chart actions | Yes | Click or drag on a chart to filter or highlight other tiles. |
| Apply filters conversationally | Yes | The filter applies to your view in that conversation. It is not a permanent change to the dashboard. |
| Ask questions about a specific tile | Yes | Uses the tile context and its underlying query. |
| Add / remove / re-chart tiles | No | The dashboard is admin-curated ground truth; editing happens in Workspaces. |
Follow-up questions run with the viewer’s data permissions. A user cannot receive an answer derived from data they are not authorized to see. A viewer can apply filters conversationally in the thread. That selection stays on their own view of the dashboard in that conversation. It is not a permanent change to the dashboard, and publishing later file changes to the artifact does not turn that viewer’s selection into the default for everyone else.
Comparison to Legacy Dashboards
Dashboards 2.0 are not a drop-in replacement for Legacy Dashboards. Key differences:
| Dimension | Legacy Dashboards | Dashboards 2.0 |
|---|---|---|
| Follow-up questions | Not supported | Conversational AI on any tile, in CoWork |
| Creation | UI-based (add tile from a worksheet) | AI-first (CoCo) plus manual editing |
| Access control | User-based (UBAC) | Role-based (RBAC) |
| Consumption surface | Snowsight > Dashboards | CoWork and Snowsight, plus shared workspaces |
| Query cache | Shared across users with the role | User-specific (caller’s rights) |
| Filters | Global to the account | Scoped per dashboard |
Upgrading from Legacy Dashboards
A built-in upgrade tool converts a Legacy Dashboard into a Dashboards 2.0 .dash file that
you can refine in Snowsight Workspaces and then create as a dashboard artifact and share.
The conversion is a direct, rule-based translation of the dashboard and doesn’t use AI.
To upgrade a dashboard:
- In Snowsight, go to Dashboards. Select Upgrade from the dashboards list, or open an individual dashboard and select Upgrade to v2.
- Snowflake converts the dashboard and opens the result as a new
.dashfile in your personal workspace in a new browser tab. - Review the converted dashboard and adjust it as needed. You can ask Cortex Code (CoCo) to refine tiles, SQL, and charts conversationally. Then create a dashboard artifact and share it.
The upgrade reproduces the dashboard’s tiles, tile SQL, chart configuration, filters, and grid layout. Account-global filters are converted to per-dashboard filters, because Dashboards 2.0 has no account-wide filter registry.
The upgrade also carries over sharing: if the Legacy Dashboard was shared with specific users, those same users automatically get access to the upgraded dashboard.
A small number of tiles might not convert automatically. When that happens, the tool keeps the original query in a Markdown tile and, where possible, suggests an equivalent Dashboards 2.0 query for you to adapt.
Differences from Legacy Dashboard filters
Snowflake’s original Dashboards product (now deprecated) used a different filter system. The table below covers the key differences.
| Dimension | Legacy Dashboards (1.0) | Dashboards 2.0 |
|---|---|---|
| Filter syntax in SQL | :filter_name, a colon-prefixed keyword that resolves as a subquery or value list | {{ filter('name') }}, a template placeholder replaced at query-execution time |
| Scope | Account-global. Filters were defined once at the account level and could be shared across all dashboards in the account. | Per-dashboard. Each filter is defined in the .dash file and belongs to that dashboard only. There is no account-wide shared filter registry. |
| Filter value computation | Pre-computed on a configurable schedule (for example, hourly) and cached. The cached values were shared across all viewers. | Loaded with the viewing user’s credentials. A prefetch cache can show the dropdown without rerunning SQL on every click. There is no scheduled cache shared across viewers. |
| Execution identity for filter values | Ran under the dashboard owner’s identity (owner’s rights). Viewers could see filter options from data they had no direct access to, because the cache was populated by the owner. | Runs under the viewing user’s identity (caller’s rights). Viewers see only options they are authorized to query. Different viewers may see different filter options if they have different data permissions. |
| Performance / freshness trade-off | Scheduled caching made large filter dropdowns fast to render, but values could be stale between refresh cycles. | A prefetch cache avoids rerunning the dropdown query on every click. It does not refresh filter values on a schedule, and it is not shared across viewers. |
Caution
Legacy Dashboard filters defined globally at the account level will need to be re-created
as per-dashboard filters in Dashboards 2.0. The :filter_name syntax is not recognized in
tile SQL; replace each occurrence with the equivalent {{ filter('name') }} placeholder
and add a corresponding filter definition to the dashboard. If you upgrade an existing
dashboard with the built-in tool, its filters are converted for you.
Migrating dashboards from third-party BI tools
You can migrate a dashboard from another BI tool, such as Tableau or Power BI, into a
Snowflake dashboard. Migration is file-based and runs in Snowsight Workspaces: you export
the dashboard from the source tool, give the exported file to Cortex Code (CoCo), and CoCo
uses the /dashboard skill to build a .dash file in your workspace.
Migration rebuilds the visualizations, not the data behind them. The data the source dashboard reads must already exist in Snowflake, and the source dashboard must query it directly. CoCo writes each tile’s SQL against those same tables. A dashboard that queries another database can’t be migrated until its data is in Snowflake.
The result is a dashboard you own and edit in Workspaces like any other. Its tiles query your Snowflake tables directly, you refine it conversationally with CoCo, and you share it as a dashboard artifact. See Artifact creation and sharing.
Note
A migrated dashboard is a starting point, not a one-to-one copy. CoCo maps the visualizations, fields, and filters it finds in the exported file to their closest Snowflake dashboard equivalents and writes tile SQL against your tables. Check each tile’s numbers against the source dashboard before you create an artifact and share it.
Supported file types
Export the dashboard from the source tool to one of the following formats:
- Tableau:
.twb,.twbx - Power BI:
.pbix,.pbit
Then either attach the file to the CoCo conversation or upload it to your workspace.
Tip
Attach screenshots of the source dashboard along with the exported file. CoCo uses them to reproduce the original layout and chart types more accurately, so the migration takes fewer rounds of correction.
Related migration paths
A dashboard migration moves the visualizations. To migrate the business logic behind them
(metric definitions, table relationships, and column descriptions), generate a semantic
view from the same Tableau or Power BI file with
Semantic View Autopilot. In CoCo, the
agent-studio
skill creates a semantic view from these sources conversationally.
Migrating the business logic first gives CoCo a semantic view to build tiles against, so you can name that view when you ask for the dashboard. See Create with Cortex Code (AI-first).
Limitations (public preview)
-
Limited automated migration. You can convert a Legacy Dashboard to Dashboards 2.0 with the built-in upgrade tool (see Upgrading from Legacy Dashboards), but a small number of tiles might need adjustment.
-
Shared dashboard artifacts are view-only. Creating and editing dashboards happens in Workspaces. Viewers in CoWork or Snowsight can’t add tiles or change chart types.
-
Per-viewer compute. Caller’s-rights execution means each viewer’s queries consume warehouse compute; there is no shared query cache across viewers.
-
Chart actions require tiles that query the same table or view. A tile written as one-off custom SQL that doesn’t query that same data can’t participate in chart actions.
-
Third-party BI migration requires Snowflake-backed data. A dashboard from another BI tool can be migrated only when the data it reads already exists in Snowflake and the dashboard queries it directly. See Migrating dashboards from third-party BI tools.
-
Deleting, renaming, or moving the source file does not keep the artifact link. The artifact can remain with a stale source path, and moving the file can force a new artifact on the next create. See Source file linkage.