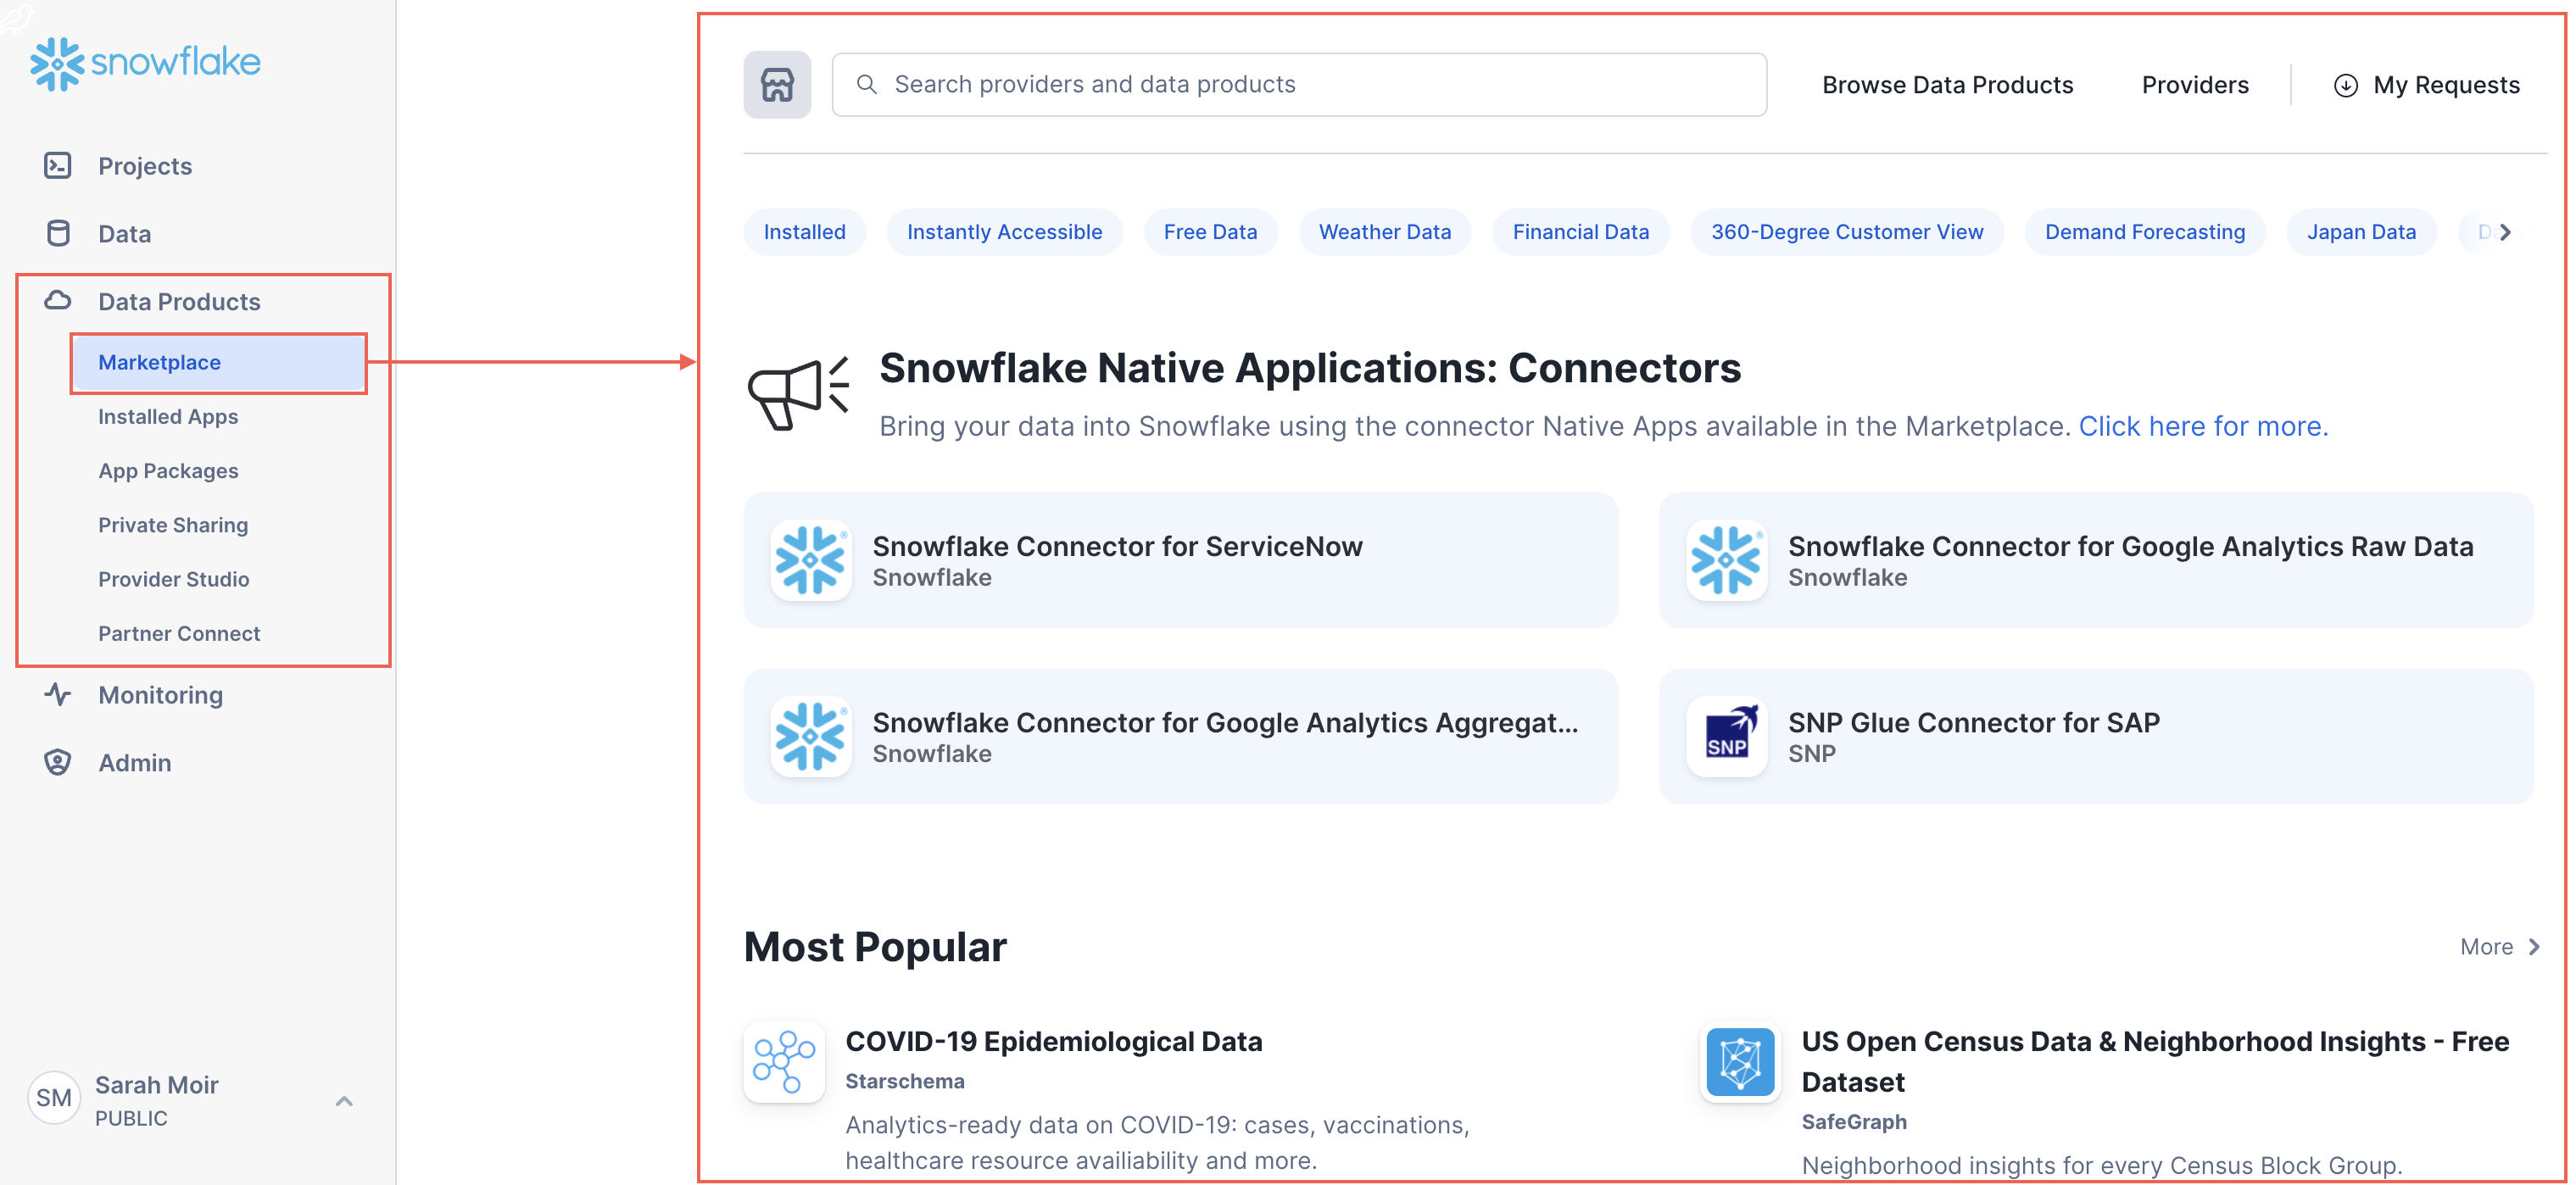
Snowsight quick tour
In Snowsight, you can perform data analysis and engineering tasks, monitor query and data loading and transformation activity, explore your Snowflake database objects, and administer your Snowflake database, including managing the cost and adding users and roles.
Snowsight lets you:
Build, test, and deploy Snowpark Python Worksheets.
Write queries and code, and take advantage of autocomplete for database objects and SQL functions in worksheets.
Organize worksheets into folders.
Share worksheets and dashboards with other users.
Visualize worksheet results in charts and dashboards.
Create and manage database objects such as databases, tables, stages, file formats, and more.
Manage costs and set budgets.
Review query history and data loading history.
See task graphs and run history.
Debug and rerun failed task graphs.
Monitor dynamic table graphs and refreshes.
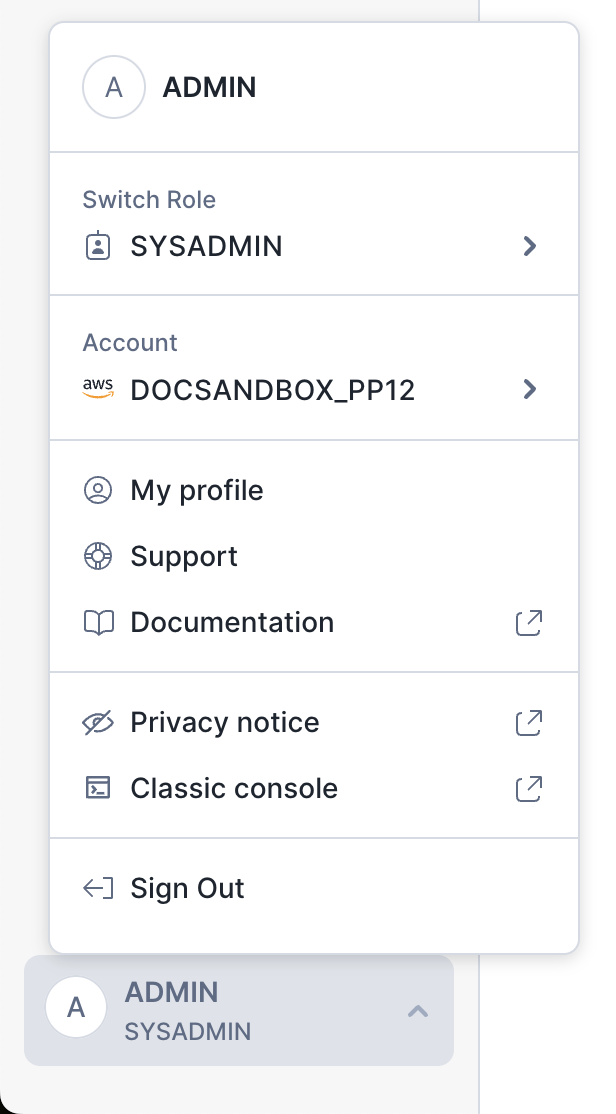
Manage and create Snowflake users and roles and visualize a hierarchy of roles and their grants.
Perform data governance tasks like masking data, adding policies, and reviewing the governance of your data.
For more information about these and other tasks that you can perform, see Snowsight: The Snowflake web interface.
Write SQL and Snowpark Python code in worksheets
Worksheets provide a simple way for you to write SQL queries (DML and DDL), see the results, and interact with them. With a worksheet, you can do any of the following:
Run ad hoc queries and other DDL/DML operations.
Write Snowpark Python code in a Python worksheet.
Review the query history and results of queries that you executed.
Examine multiple worksheets, each with its own separate session.
Export the results for a selected statement, while results are still available.
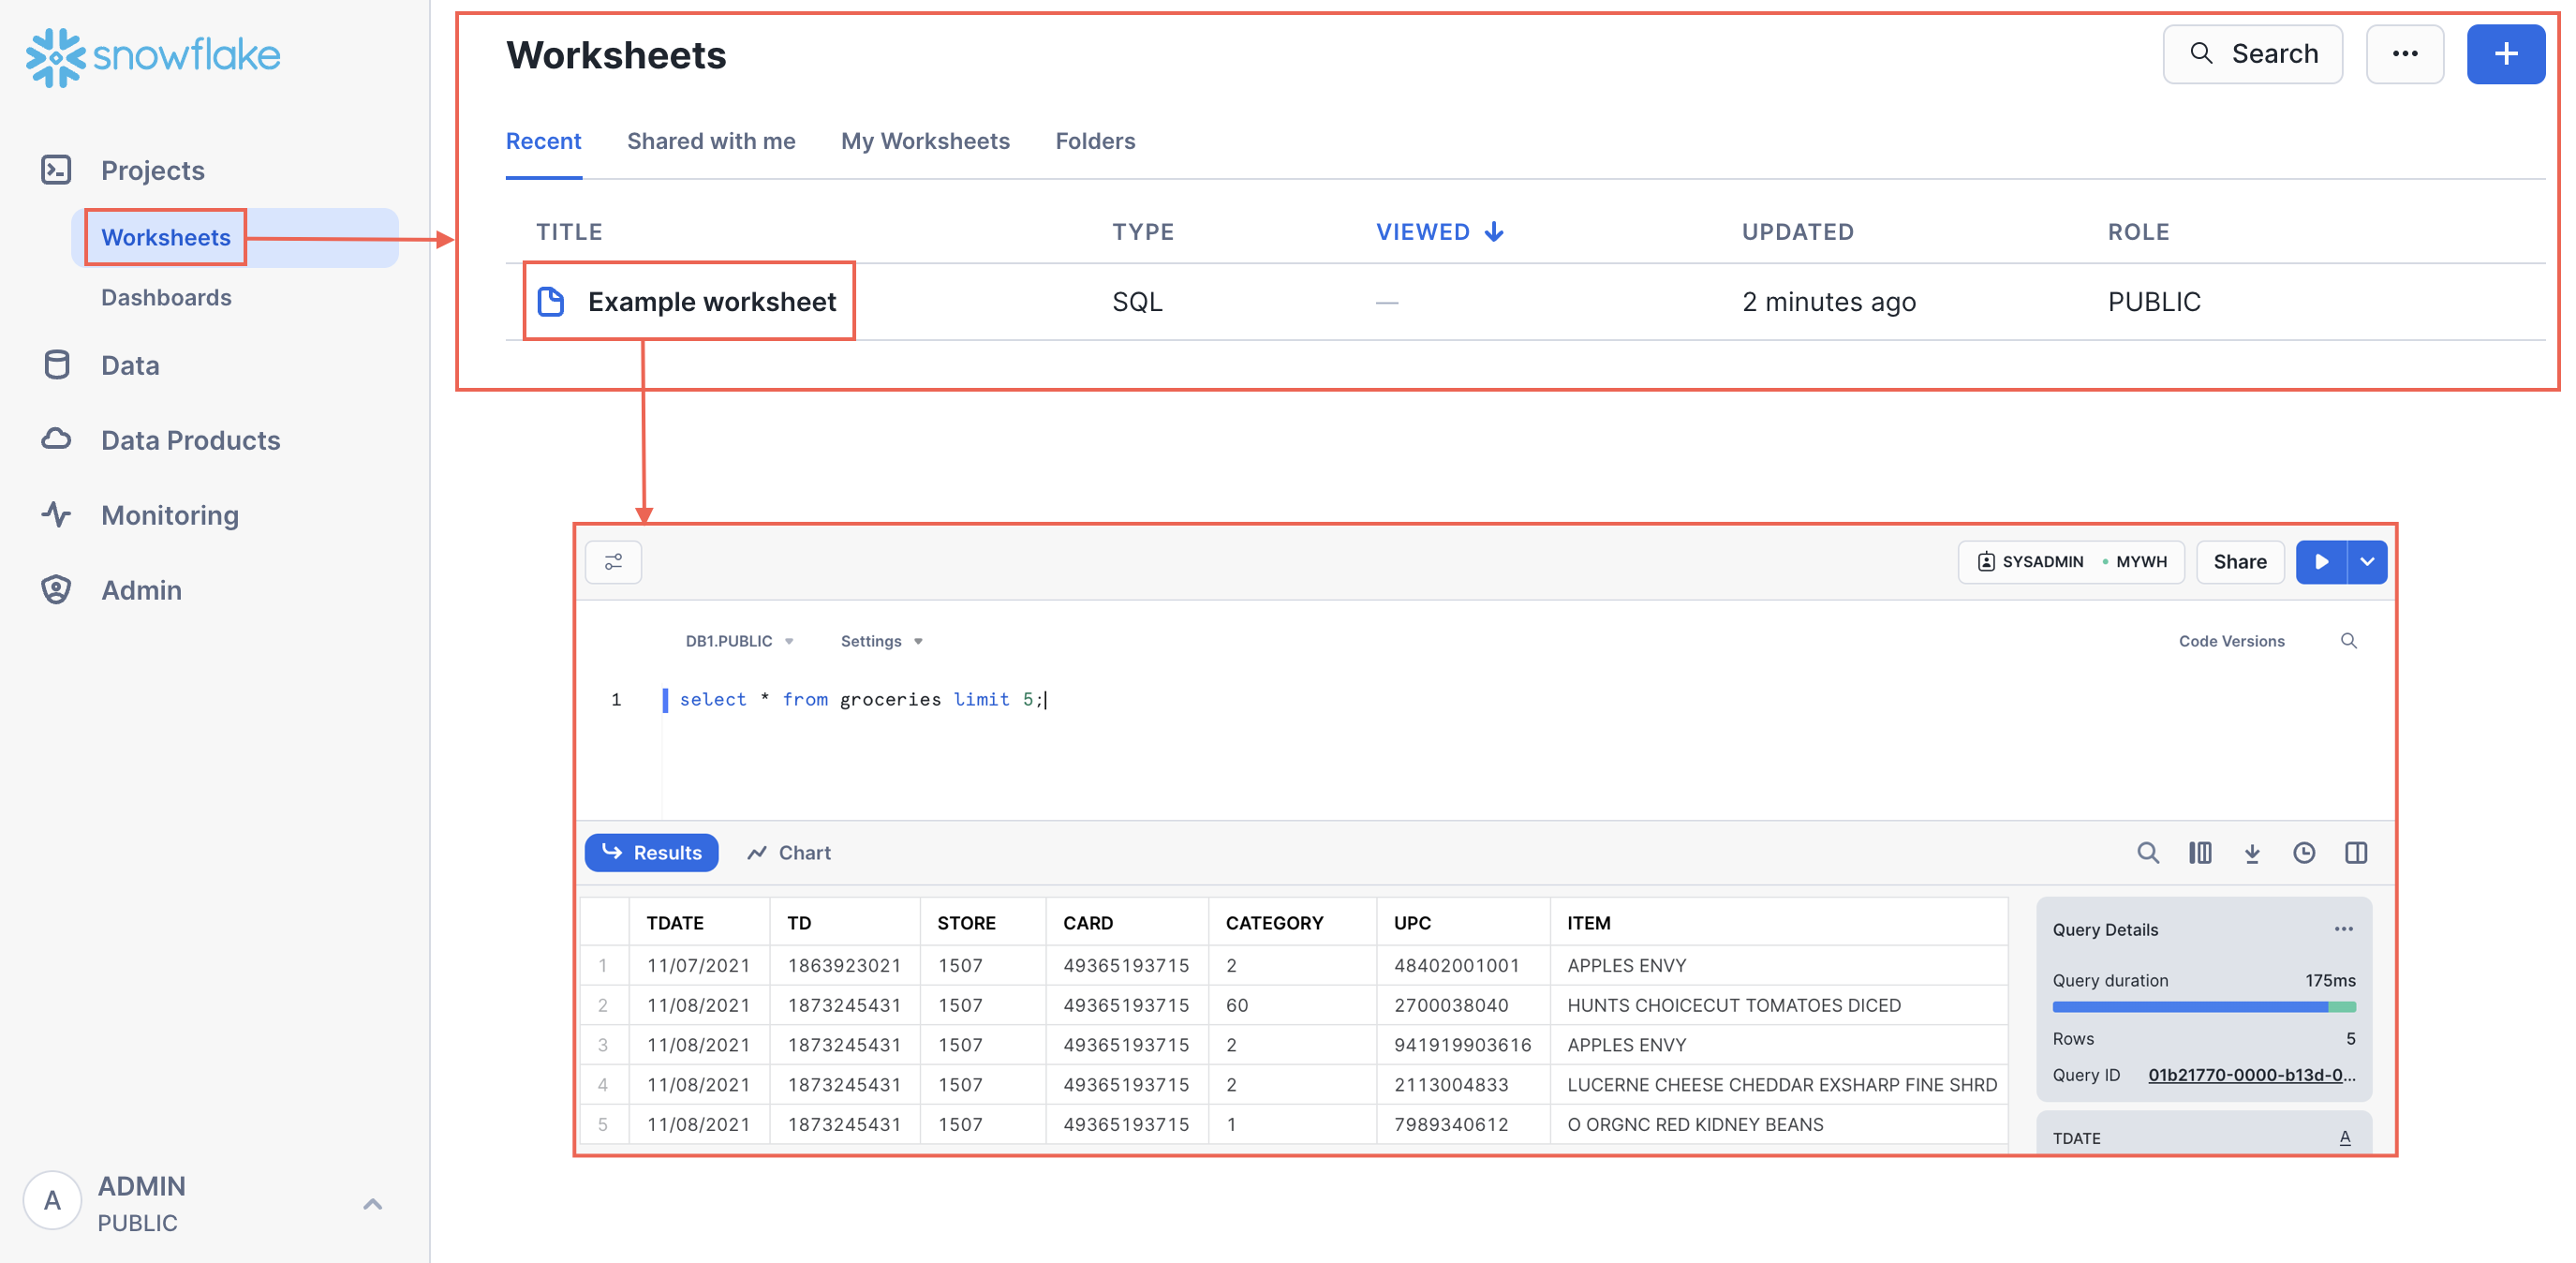
For more details, see:
Visualize query results with charts and dashboards
When you run a query in Snowsight, you can choose to view your results as a chart. You can also create a collection of charts as a Dashboard, allowing you to review your data more easily. Dashboards provide flexible collections of charts arranged as tiles. Dashboard charts start with SQL to generate results and associated charts. You can share these charts with others, modify the charts, and display them as dashboard tiles.
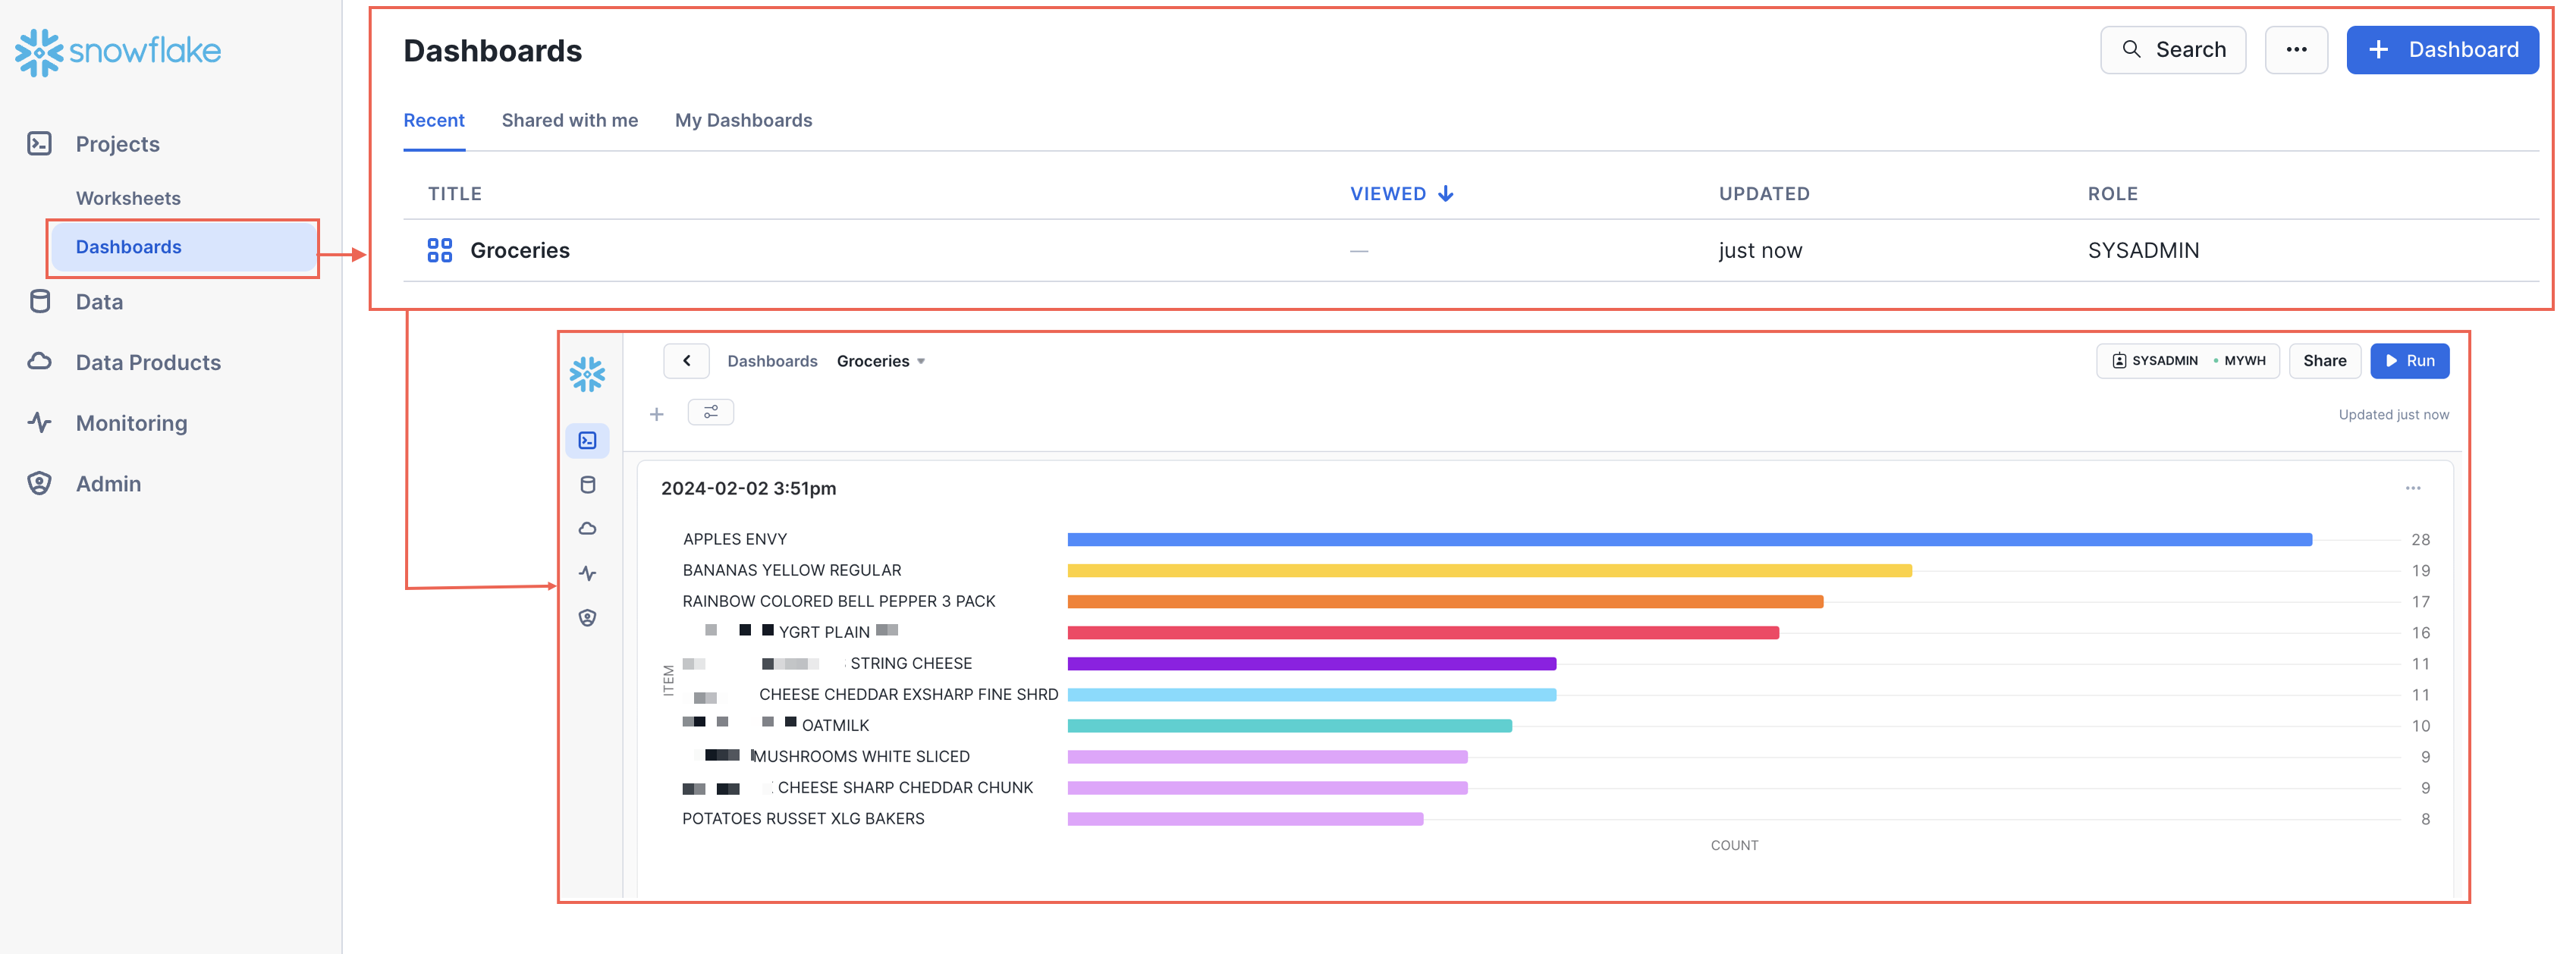
To learn more about charts, see Visualizing worksheet data. To learn more about dashboards, see Visualizing data with dashboards
Explore and manage your database objects
You can explore and manage your database objects in Snowsight as follows:
Explore databases and objects, including tables, functions, views, and more using the database object explorer.
Create objects like databases, tables, file formats, and more.
Search within the object explorer to browse database objects across your account.
Preview the contents of database objects like tables, and view the files uploaded to a stage.
Load files to an existing table, or create a table from a file so that you can start working with data in Snowflake faster.
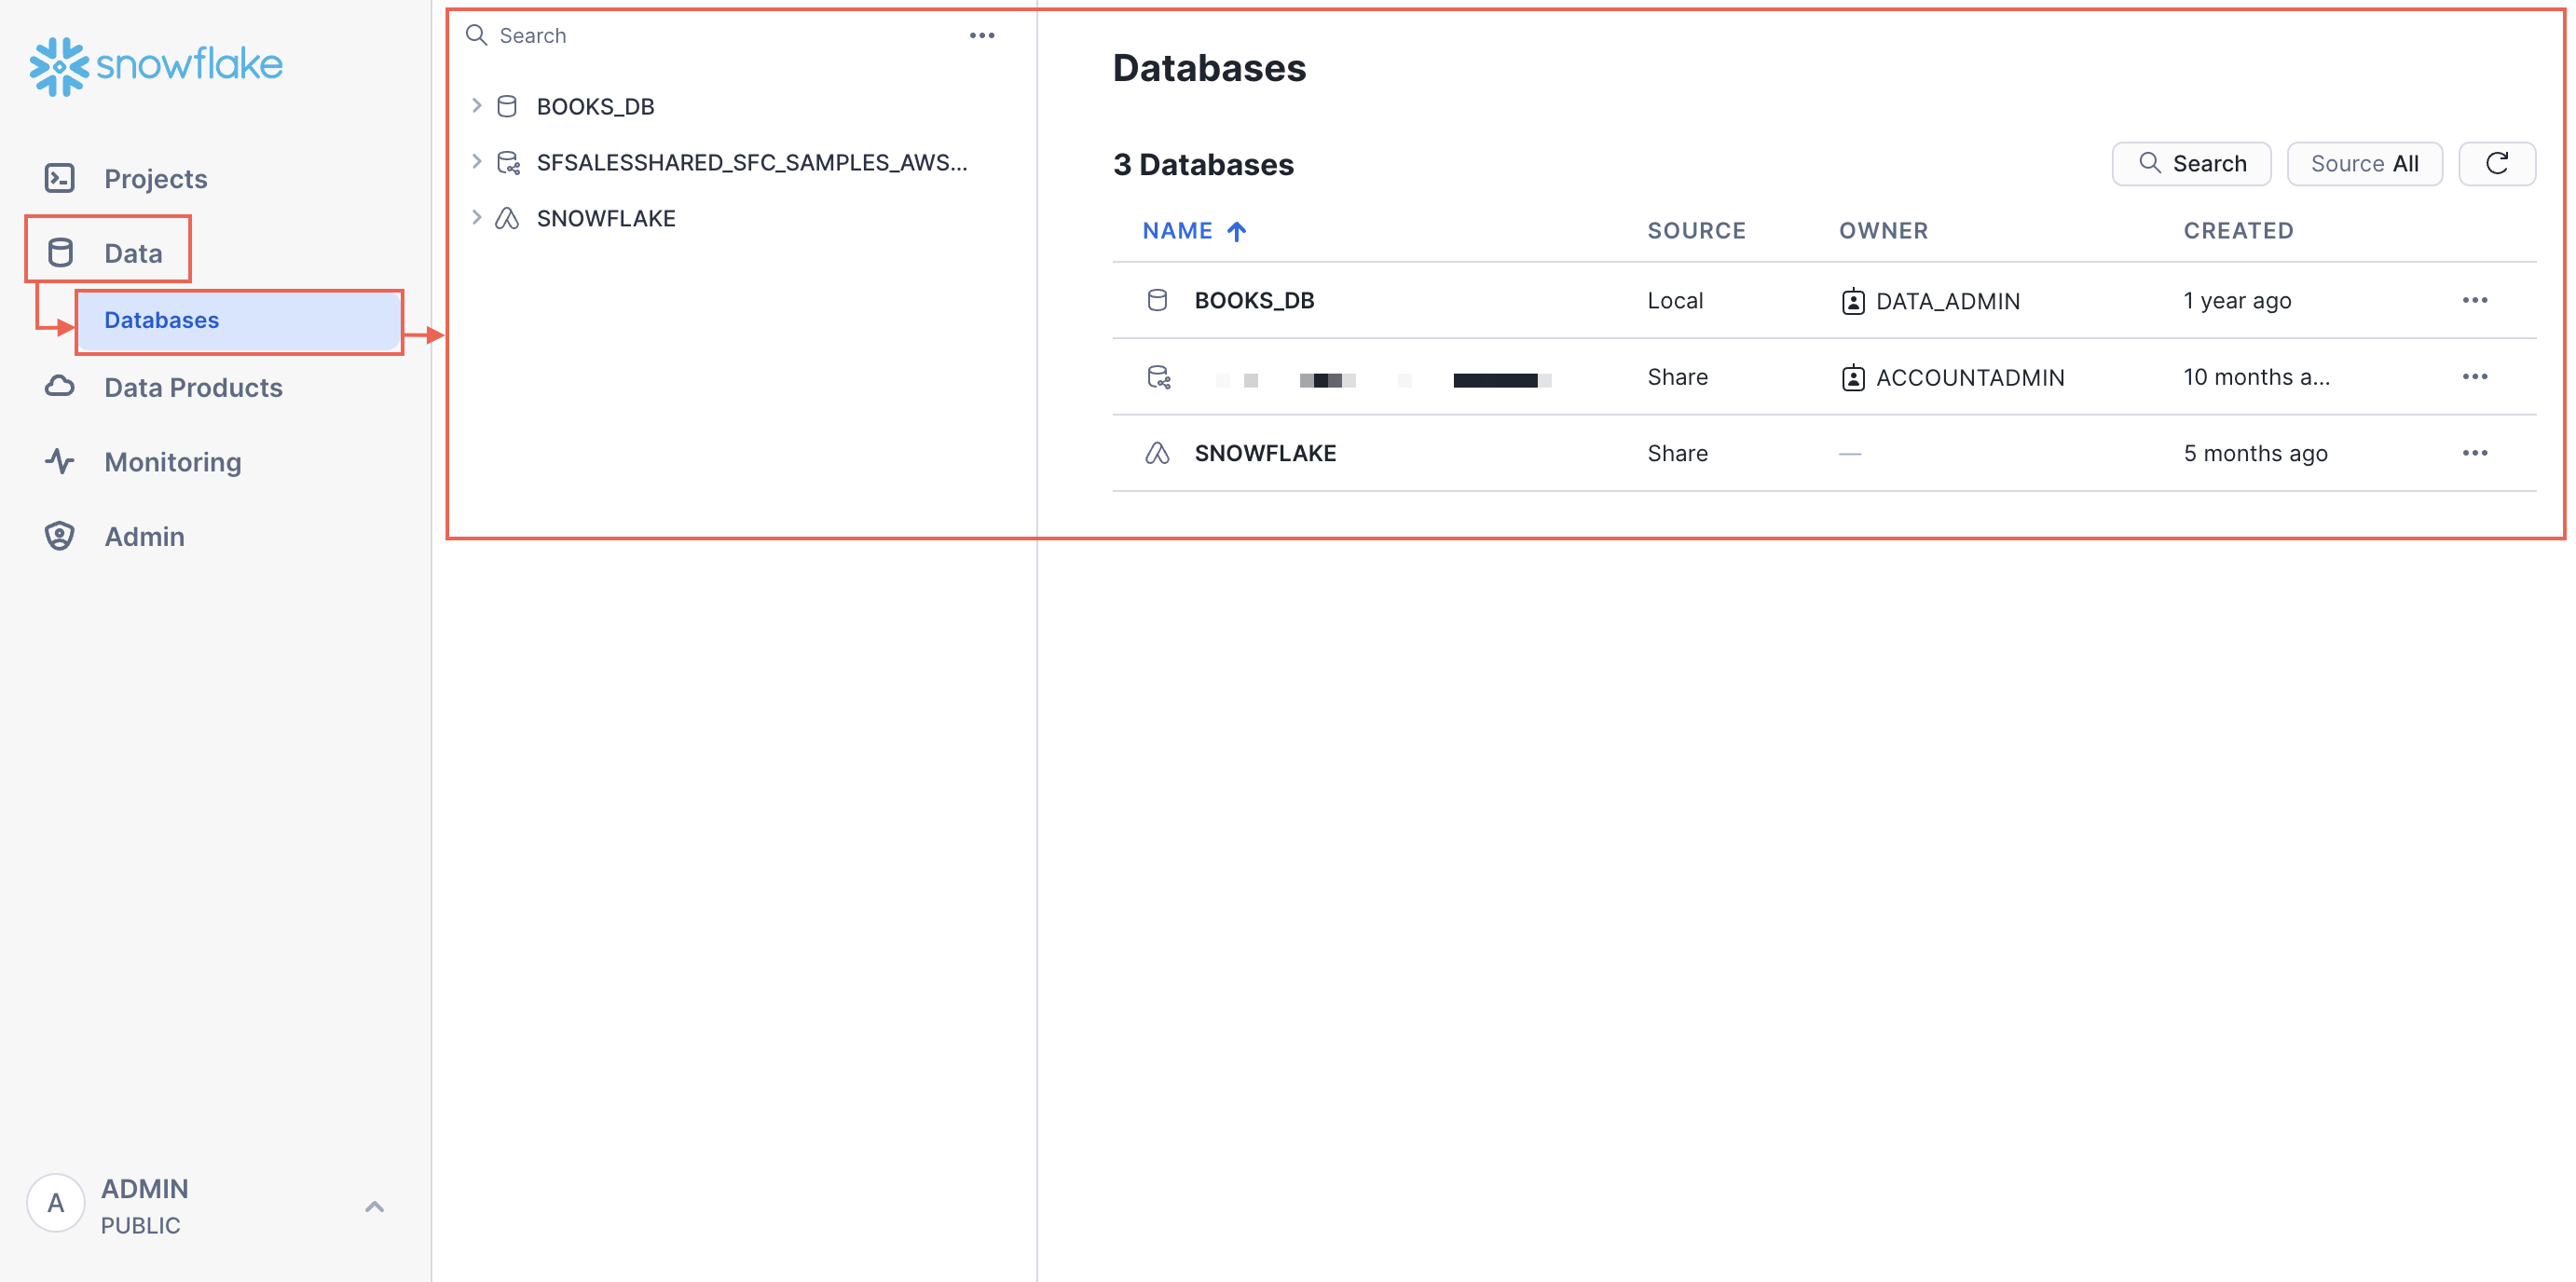
To learn more, see:
Monitor activity in Snowsight
You can monitor and view query details, explore the performance of executed queries, monitor data loading status and errors, review task graphs, and debug and re-run them as needed. You can also monitor the refresh state of your Dynamic Tables and review the various tagging and security policies that you create to maintain data governance.
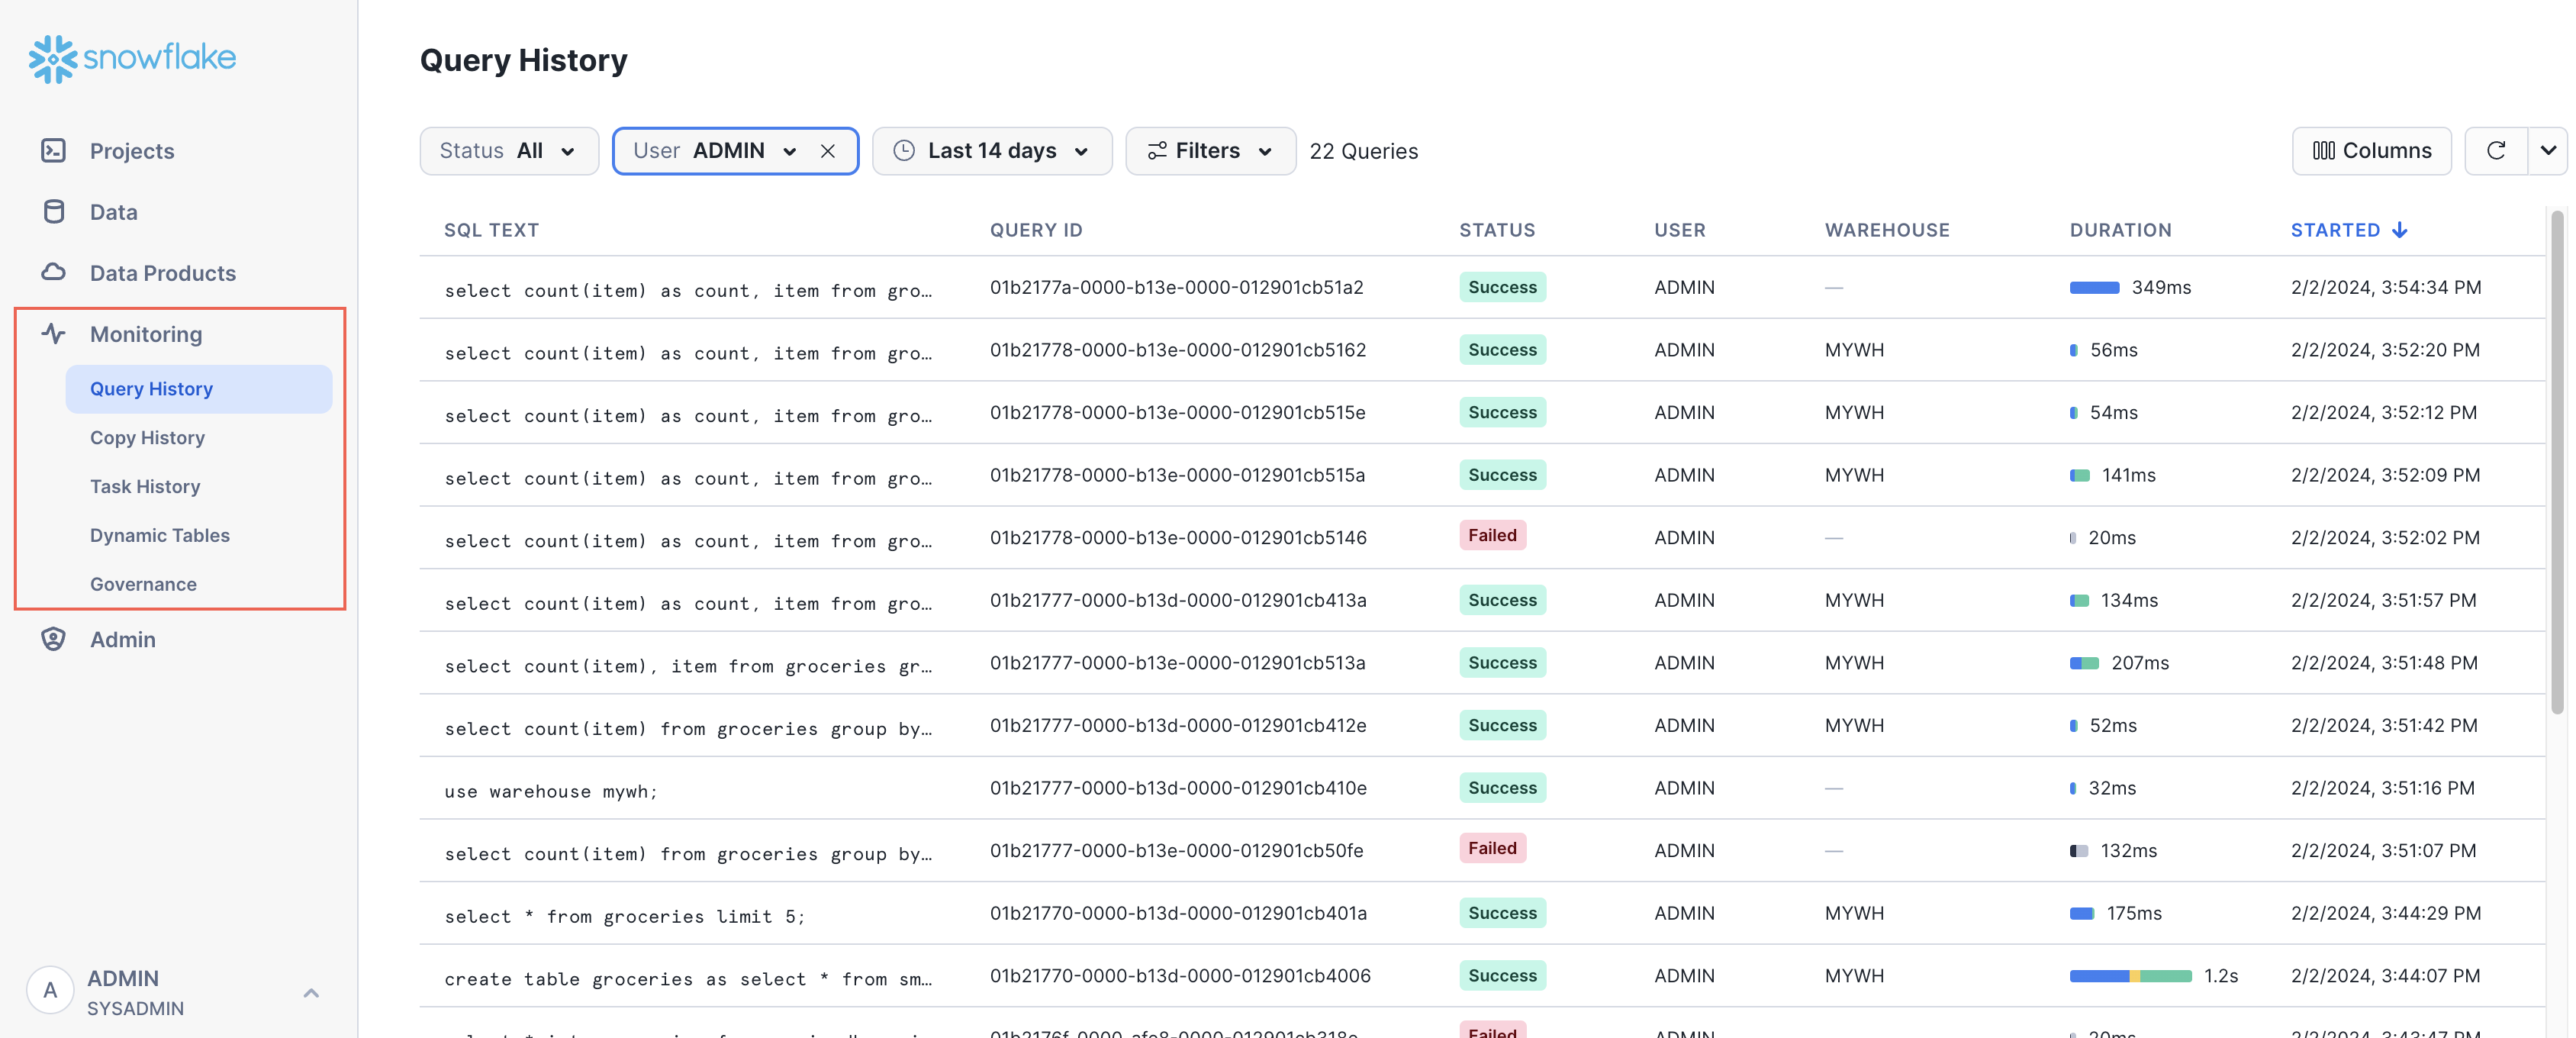
For more information, see:
Perform administrative tasks in Snowsight
Admin pages let you understand Snowflake data use, manage warehouses, monitor resources, manage users and roles, administer Snowflake accounts, and more.
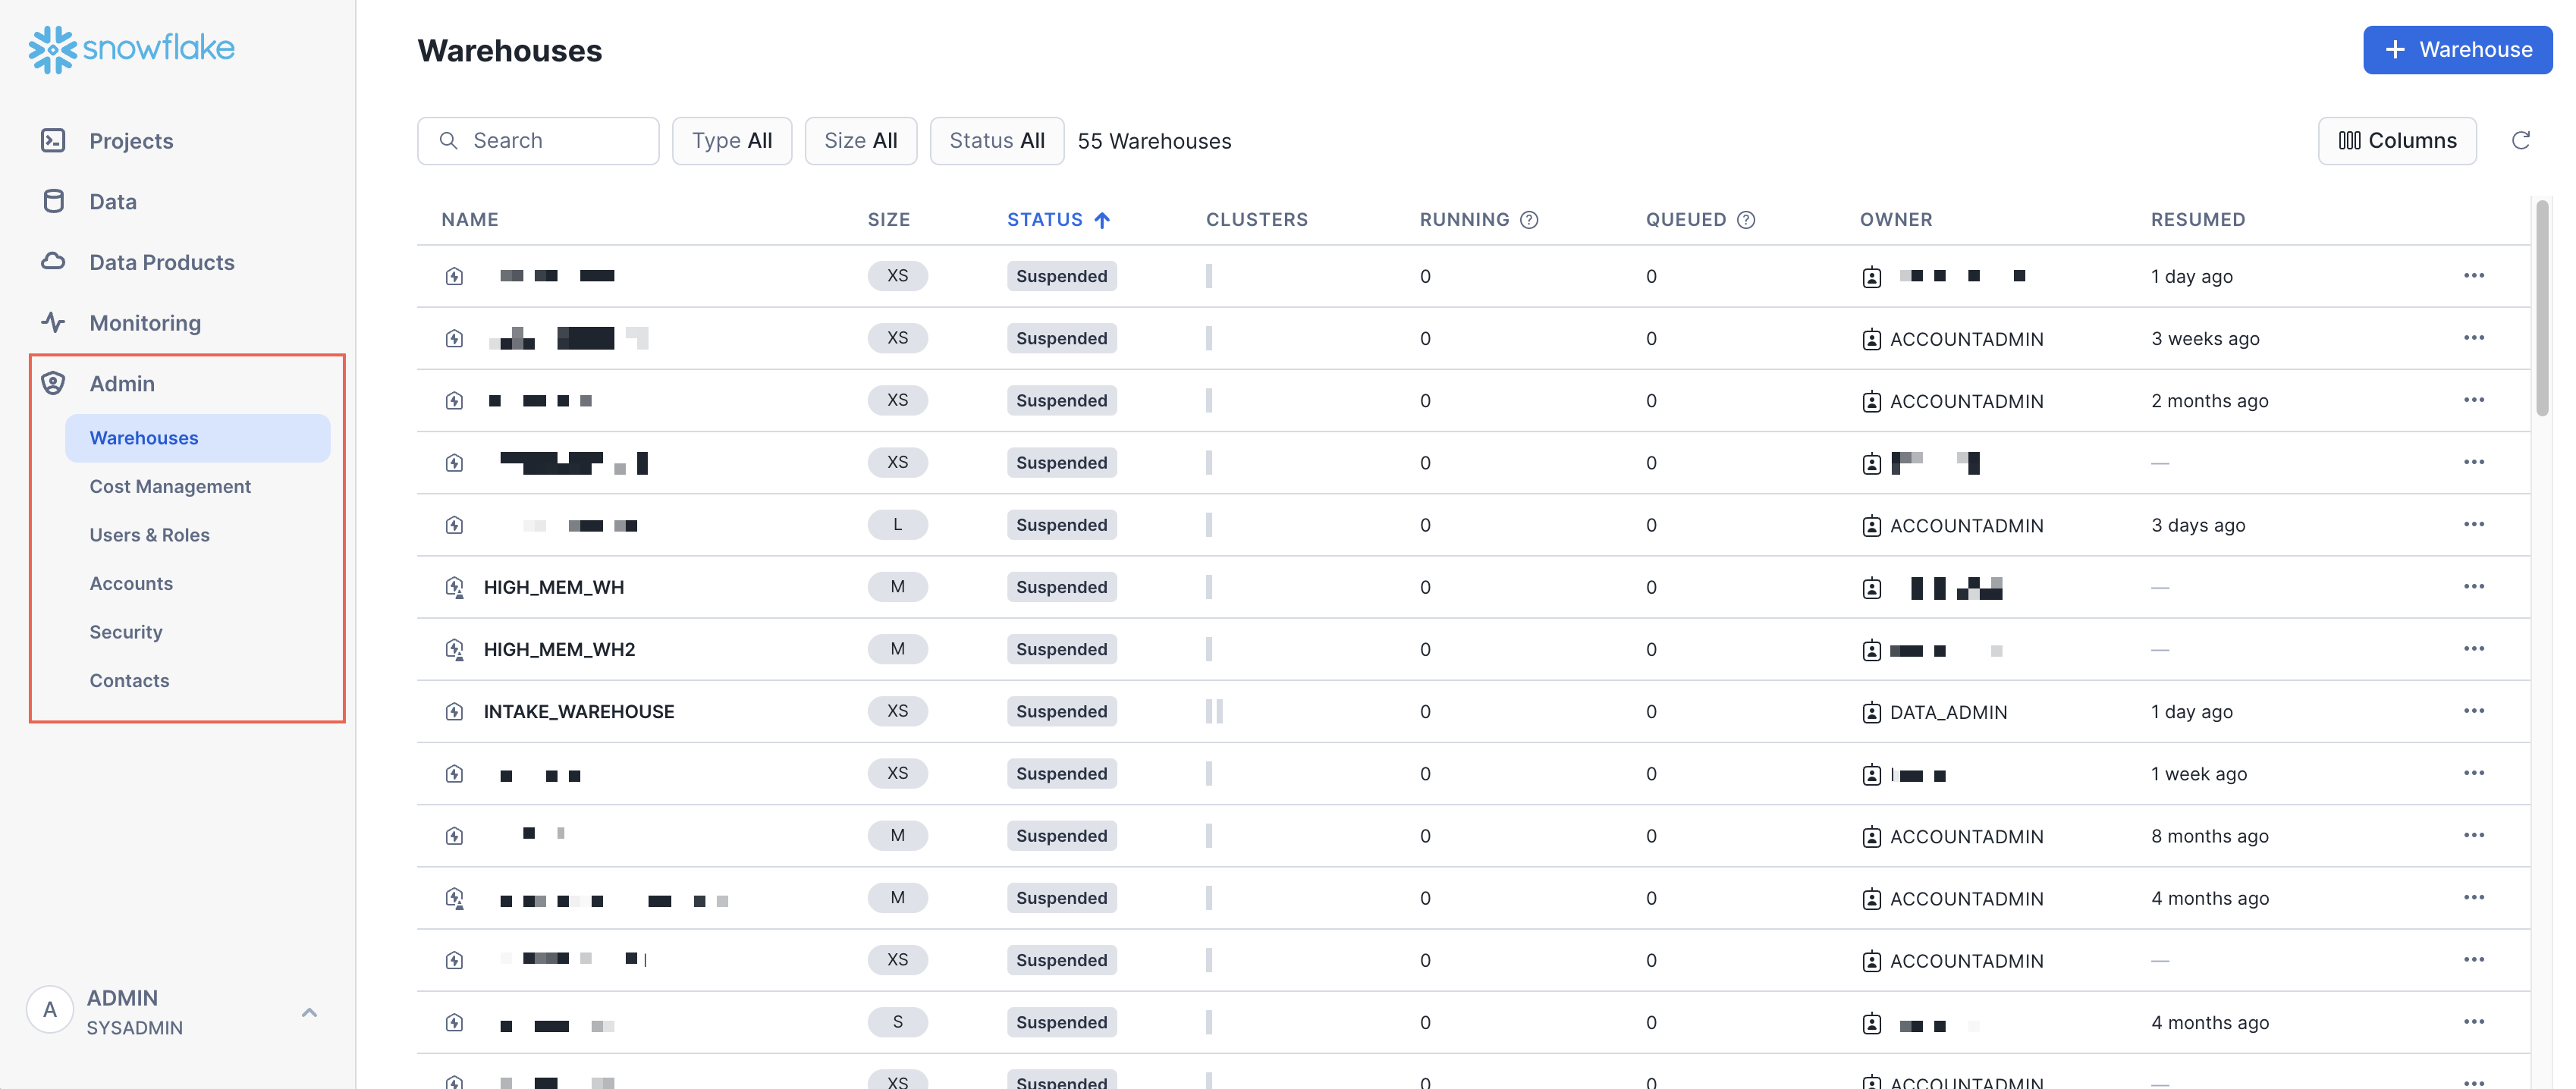
For more information, see:
