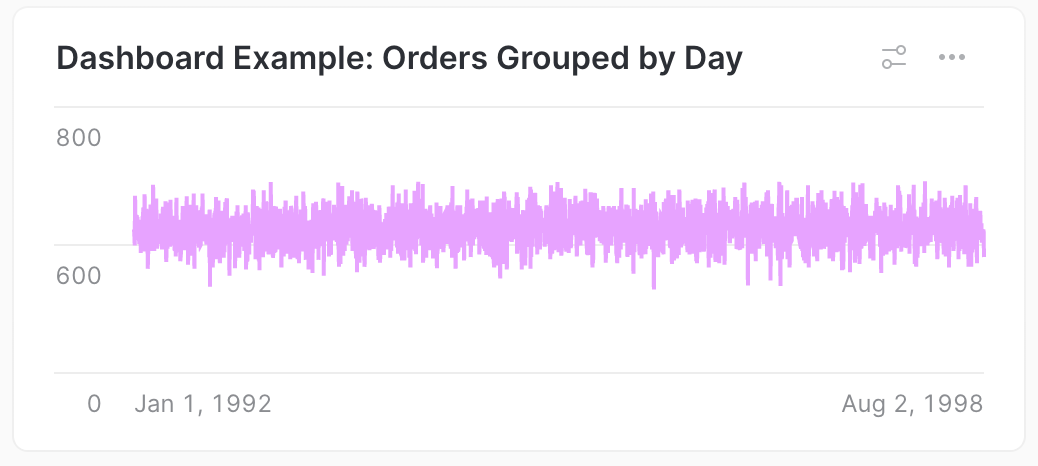
Visualizing data with dashboards
You can use dashboards to visualize and communicate query results using charts in Snowsight. Dashboards are flexible collections of charts arranged as tiles. The charts are generated by query results and can be customized.
Important
Legacy Dashboards will be removed from Snowflake on June 22, 2026. For migration options and the full deprecation timeline, see Deprecation of Legacy Worksheets and Dashboards.
You can also create dashboard tiles from charts in worksheets. For more details, see Visualizing worksheet data.
Create a dashboard
You can create an empty dashboard or create a dashboard directly from a worksheet.
Create an empty dashboard
To create an empty dashboard, complete the following steps:
- Sign in to Snowsight.
- In the navigation menu, select Projects » Dashboards.
- Select + Dashboard.
- Enter a name for the dashboard, and then select Create Dashboard.
Create a dashboard from an existing worksheet
You can also use an existing worksheet to create a dashboard.
When you use a worksheet to create a dashboard, the worksheet is removed from the list of worksheets and can only be accessed from the dashboard. The worksheet query is stored in the dashboard and can be modified in that context.
To create a dashboard using an existing worksheet, complete the following steps:
- Open a worksheet.
- Hover over the name of the worksheet and select
 , and then select Move to.
 - Select New dashboard.
- Enter a name for the dashboard, and then select Create Dashboard. The dashboard opens, displaying a tile based on the worksheet you used.
Note
If the worksheet is shared with other users, those users lose access to the worksheet when you create a dashboard because the worksheet is removed when the dashboard is created. Permissions on the worksheet are revoked and links to the worksheet no longer function. For more details about sharing dashboards, see Share dashboards.
About using dashboards
After you create a dashboard, you can manage, add tiles, filters, and share the dashboard with other users.
Tiles visualize data on your dashboards as charts and tables. Hover over charts to view details about each data point.
Open a dashboard
To open a dashboard, complete the following steps:
- Sign in to Snowsight.
- In the navigation menu, select Projects » Dashboards.
- Locate the dashboard that you want to open:
- The Recent tab displays the dashboards you opened most recently.
- The Shared With Me tab displays dashboards that your colleagues shared with you.
- The My dashboards tab displays dashboards that you created and own.
You can also search the names and contents of worksheets and dashboards.
Manage a dashboard
While viewing a dashboard, you can take the following actions on the dashboard:
- Select the dashboard name to rename, duplicate, or delete the dashboard.
- Select + to add a tile to the dashboard. See Add a tile to a dashboard.
- Select
 to show, hide, and manage custom filters that you can use in queries on the dashboard.
For more details on filters, see Filter query results in dashboards and worksheets.
to show, hide, and manage custom filters that you can use in queries on the dashboard.
For more details on filters, see Filter query results in dashboards and worksheets. - Use the context selector
 to specify the role and warehouse to use for running the queries in the dashboard.
 - Select Share to share the dashboard with other Snowsight users. See Share dashboards for details.
- Select Run to run all the queries for the dashboard tiles.
Add a tile to a dashboard
To add a tile to a dashboard, complete the following steps:
-
Select + (
 ).
). -
Select New Tile from Worksheet.
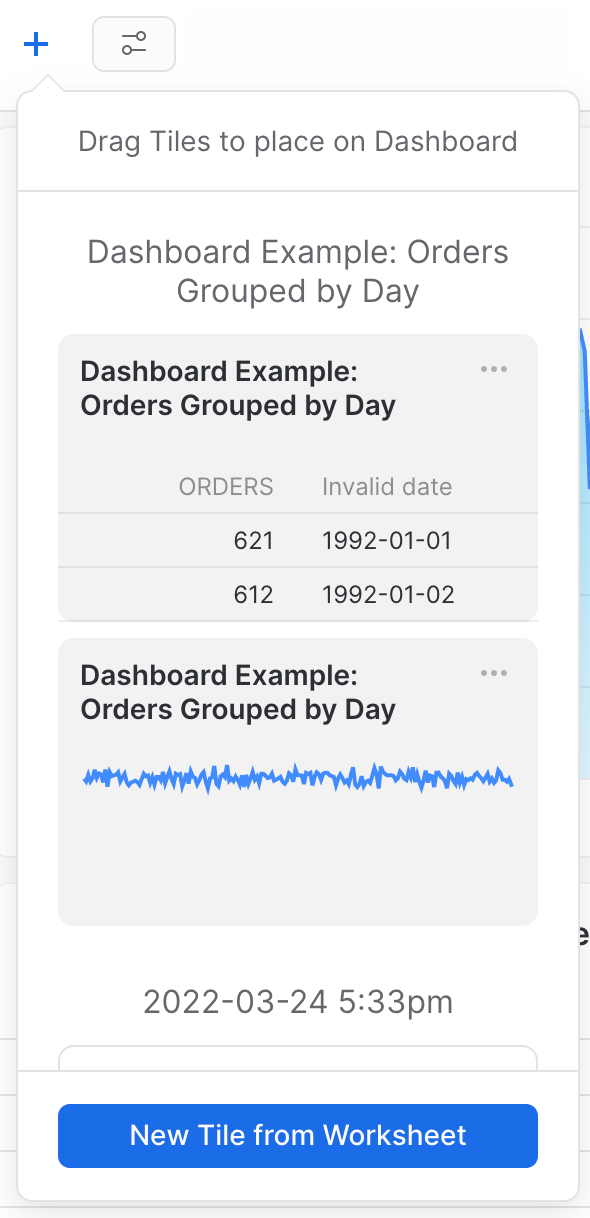
A blank worksheet opens, overlaying the dashboard.
-
Use the worksheet to build your query.
To learn more about queries and worksheets, see Querying data using worksheets.
-
When you finish writing your query, select Return to <dashboard name> to save your worksheet and add it to the dashboard.
Add an existing worksheet to a dashboard
To add an existing worksheet as a tile, complete the following steps:
-
On the worksheet tab, select
 , and then select Move to.
 -
Select an existing dashboard.
The worksheet is added to the dashboard and removed from the list of worksheets. A tile showing a chart for the worksheet displays on the dashboard.
Rearrange the order of tiles
By default, tiles are added to the bottom of the dashboard.
To rearrange the tiles on a dashboard, drag a tile to a new position. As you drag the tile, a preview of the new position appears.
Edit charts
To edit a chart that appears in a tile, complete the following steps:
-
From the tile menu (
 ), select View Chart.
The chart opens in a worksheet.
-
Make changes to the chart. To learn more about charts, see Visualizing worksheet data.
-
When you are finished editing the chart, select Return to <dashboard name> to save your changes and return to the dashboard.
Edit queries
To edit the query used for a tile, complete the following steps:
-
From the tile menu (
), select Edit query.The query opens in a worksheet window.
-
Make changes to the query. For more about editing queries in worksheets, see Querying data using worksheets.
-
When you finish editing the query, select Return to <dashboard name> to save your changes and return to the dashboard.
Configure a tile display
By default, when you move a worksheet to a dashboard, the corresponding tile displays a chart.
To change the tile from a chart to a table of the query results, complete the following steps:
- Remove the tile.
- Add a tile and drag the table version of your query to your dashboard.
If a tile displays a table and you want to add a chart tile based on the same query, edit the query of the tile by completing the following steps:
-
From the tile menu (
), select Edit Query. -
Select Chart.
-
Select Return to <dashboard name> to save your changes and return to the dashboard.
A new tile is added at the bottom of the dashboard with a chart view of the table. For details on making changes to the chart, see Edit charts.
Duplicate a tile
To duplicate a tile, complete the following steps:
-
From the tile menu (
), select Duplicate Tile.A copy of the tile appears at the bottom of the dashboard.
Remove a tile
When you want to remove a tile from your dashboard, but still preserve the underlying query, complete the following step:
-
To remove a tile, on the tile menu (
), select Unplace Tile.The tile is removed from the dashboard, but remains available to add to the dashboard from the Add tile menu.
Delete a tile
Warning
Deleting a tile from a dashboard also deletes the underlying queries. This action cannot be undone. If you want to remove the tile but preserve the query, see Remove a tile.
If you delete a tile with a query that is used by another tile, such as a table and chart view of the same query results, both tiles are deleted.
To delete a tile, complete the following steps:
- From the tile menu (), select Delete.
- Select Delete to permanently delete the tile and its underlying query from the dashboard.
Share dashboards
Editors and owners can share a dashboard with individual collaborators or by enabling and using link sharing.
The queries that drive dashboards in Snowsight use unique sessions with assigned roles and warehouses. To view shared dashboards, the Snowflake user must use the same role as the session context for the queries that drive the dashboard.
To share a dashboard, complete the following steps:
- Open a dashboard.
- Select Share.
- Enter the names or usernames of the Snowflake users you want to invite to use your dashboard. The list only shows users that have previously signed in to Snowsight. To share with someone who has not yet signed in to Snowsight, share a link instead (ensure that you have enabled link sharing).
- Optionally, set how people with the link can interact with the dashboard. By default, people with the link cannot view the dashboard. For example, you can choose to allow people to view the results on the dashboard, but not run the underlying queries.
- Optionally, select Get Link to get a link to your dashboard that you can share with others.
- Select Done.
Note
Dashboards run exclusively with the user’s primary role, regardless of the value set for DEFAULT_SECONDARY_ROLES. This behavior simplifies governance and enhances security by disabling secondary roles in dashboards.
For more details about sharing permissions for dashboards and worksheets, see Permissions for shared worksheets. You cannot organize dashboards into folders.