Diagnosing common dynamic table refresh issues
This topic addresses solutions for troubleshooting dynamic tables that don’t refresh as expected:
Some actions might be restricted due to limitations on using dynamic tables or if you don’t have the necessary privileges. For more information, see Choose between dynamic tables, streams and tasks, and materialized views and Dynamic table access control.
If you encounter an issue not listed here, contact Snowflake Support.
| Issue | Solution |
|---|---|
| My dynamic table is using full refresh instead of incremental refresh. | A dynamic table’s actual refresh mode is determined at creation time
and is immutable afterward. If not specified explicitly, the refresh mode defaults to For consistent behavior across Snowflake releases, explicitly set the refresh mode on all dynamic tables. For
example, if you want your dynamic tables to refresh only incrementally, you must explicitly set the refresh mode to
Using a role with the necessary privileges, you can verify the refresh mode using one of the following methods:
|
| My dynamic table’s incremental refresh is slow. | For detailed diagnostic guidance and common performance patterns, see Diagnose slow refreshes. You can also use Refresh History to view variance or spot outliers:
|
| My dynamic table is running an empty refresh but I am seeing a cost. | Refreshes that produce zero net new rows (that is, zero rows added, updated, or deleted) consume warehouse resources when they’re associated with changes in any of the upstream objects referenced by the dynamic table. For example, if the associated virtual warehouse is suspended and no changes in base objects are identified, the suspended virtual warehouse doesn’t resume and no credits are consumed. This is referred to as a NO_DATA refresh. Conversely, if changes are identified, the virtual warehouse is automatically resumed to process the updates, which consumes warehouse resources even if the net result is zero rows applied to the dynamic table. If you’re seeing a cost but you haven’t made any changes to your dynamic table, it might be due to a change in your source table. You can use the Refresh History tab in Snowsight to check if virtual warehouse credits were consumed:
For more information, see Understanding costs for dynamic tables. |
| My dynamic table is reinitializing. | Your dynamic table might be reinitializing due to one of the following reasons:
For general information about initialization, see Understanding dynamic table initialization. |
Debugging dynamic tables
This topic addresses solutions for troubleshooting dynamic tables that don’t run as expected.
Some actions might be restricted due to limitations on using dynamic tables or if you don’t have the necessary privileges. For more information, see Choose between dynamic tables, streams and tasks, and materialized views and Dynamic table access control.
If you encounter an issue not listed here, contact Snowflake Support.
| Issue | Solution |
|---|---|
| I can’t see the metadata for my dynamic table. | To view the metadata and Information Schema of a dynamic table, you must use a role that has the MONITOR privilege on that dynamic table. For more information, see Privileges to view a dynamic table’s metadata. |
| My dynamic table is suspended. | A dynamic table might be suspended for several reasons:
To see the reason why your dynamic table was suspended, do the following:
|
Troubleshooting skipped or failed dynamic table refreshes
This topic helps you troubleshoot skipped or failed refreshes. For slow refresh diagnostics, see Monitor dynamic tables.
When monitoring your dynamic table refreshes, note the following:
- If you see many SKIPPED entries, see Skipped refreshes.
- If you see consistent FAILED entries, see Failed refreshes.
- If you see a SCHEDULED or EXECUTING entry stuck for a long time, see Monitor dynamic tables.
Skipped refreshes
Dynamic tables refresh on a schedule. When a scheduled refresh starts, the following situations might cause the refresh to skip:
-
If the dynamic table being refreshed has another dynamic table upstream, and the refresh for the upstream failed or was skipped.
-
If a previous refresh for the dynamic table is still running.
-
If the dynamic table’s refresh often takes longer than the target lag or there’s a significant difference between the target and actual lag, Snowflake might skip a refresh to reduce the rate of future skips.
For instance, if a dynamic table has a 1-minute target lag but typically takes one hour to refresh, the system adjusts the “actual lag” accordingly.
To improve refresh performance, see Optimize queries for incremental refresh.
Manual refreshes are never skipped but they can cause other scheduled refreshes to skip, especially if you perform frequent manual refreshes on a dynamic table. Doing so can prevent downstream dynamic tables from refreshing. For this reason, Snowflake recommends that you avoid frequently performing manual refreshes on a dynamic table with downstream dynamic tables that are expected to refresh according to target lag.
Failed refreshes
Refresh failures are typically caused by issues with the dynamic table’s query definition, input data (for example, parsing errors), or upstream failures.
Find failed refreshes
To find failed refreshes, query the refresh history:
You can also use the Refresh History page in Snowsight to view failed refreshes. The Source Data Timestamp column shows the time of the last successful refresh. A failed refresh doesn’t advance this value. If it’s far behind the target lag, your dynamic table is lagging.
Diagnose failed refreshes
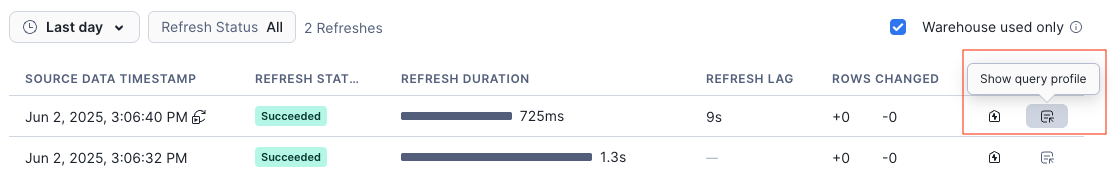
Use the Query Profile to troubleshoot by selecting Show query profile next to each refresh. This shows the execution graph of the query.
Use the Graph view in Snowsight to visualize dependencies. A failed or suspended upstream dynamic table causes its downstream tables to fail. For more information, see View the graph of tables connected to your dynamic tables.
Query event tables for failures
You can query an event table to find refresh failures across your dynamic tables:
For more information about configuring event tables and setting up alerts, see Monitor dynamic tables.