Dynamic Tables Insights
Dynamic Tables Insights proactively analyzes each dynamic table’s declarative SQL definition and refresh execution metrics to surface actionable performance insights. Rather than manually auditing complex pipelines, you can use the Snowsight interface or Snowflake CoCo to identify and resolve structural bottlenecks that increase refresh latency and compute cost.
How Dynamic Tables Insights work
Dynamic Tables Insights evaluates the SQL definition of each dynamic table and monitors its refresh execution over time. When it detects a pattern that prevents efficient incremental processing, or causes incremental maintenance to cost as much as a full refresh, it generates a recommendation for that table.
Insights surface two categories of issues:
- Query structure: SQL patterns that block incremental refresh optimization, such as an aggregate function buried inside a subquery or a deduplication clause that is not at the outermost level of the query.
- Refresh execution characteristics: Runtime conditions that surface potential improvements, such as using ADAPTIVE refresh mode instead of INCREMENTAL or increasing your warehouse size.
Find and resolve insights in Snowsight
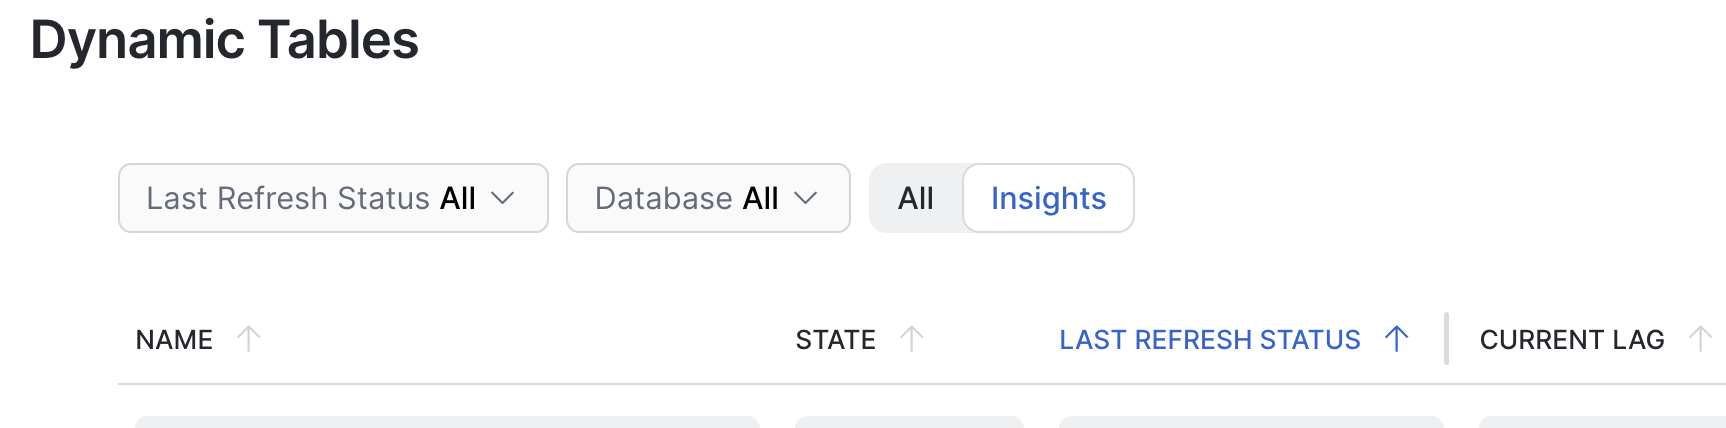
Snowsight Dynamic Tables landing page: On the Dynamic Tables list page in Snowsight, select the Insights filter to see all dynamic tables across your account that have active recommendations.
Individual Dynamic Tables insights: Open a specific dynamic table’s detail or overview page. When insights are available, an Insights panel appears alongside the refresh graph and execution metrics.
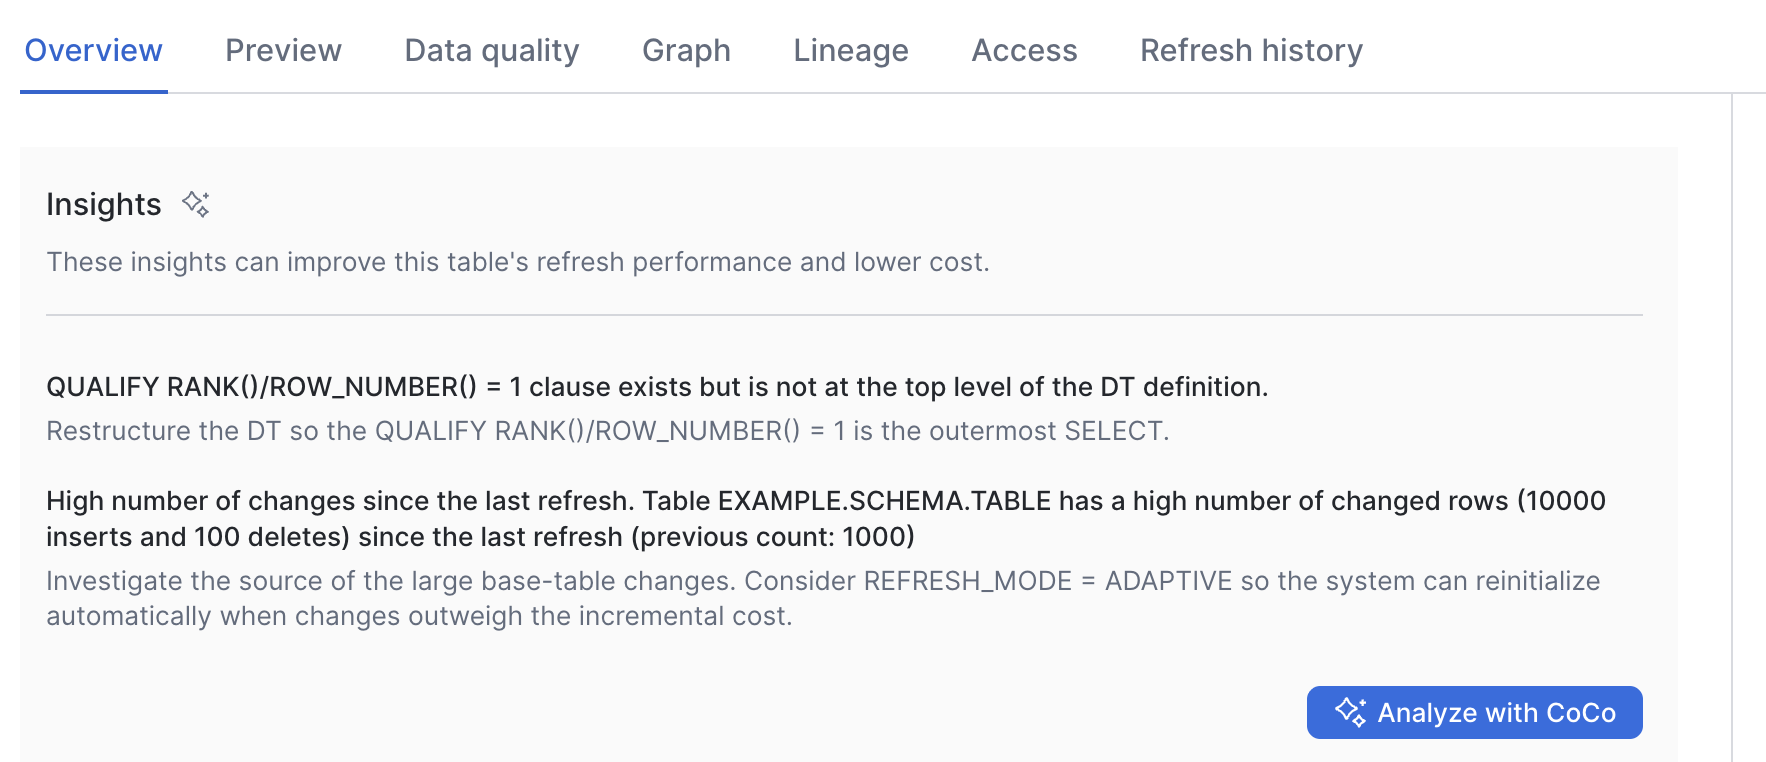
To resolve an insight, open the detail view and click Analyze with CoCo on the Insights panel. CoCo will:
- Evaluate the dynamic table’s upstream and downstream dependencies.
- Explain why the current SQL structure causes the flagged pattern.
- Generate ready-to-use DDL (
CREATE OR ALTER DYNAMIC TABLE ...) to apply the fix. - Let you review and apply the change directly.
You can also run this sample query to view the list of dynamic tables that have insights:
Insights reference
The following table lists all insight codes, what they detect, and the recommended action.
| Insight code | Insight | Recommendation |
|---|---|---|
AUTO_RESOLVED_TO_FULL_REFRESH | REFRESH_MODE = AUTO was resolved to FULL. | Check REFRESH_MODE_REASON in SHOW DYNAMIC TABLES or INFORMATION_SCHEMA.DYNAMIC_TABLES() to see why FULL was chosen, or set REFRESH_MODE = FULL explicitly if a full refresh on every cycle is acceptable. |
CHANGED_BASE_TABLES_UNDER_JOIN | One or more tables feeding a JOIN in this dynamic table had a high number of changed rows since the last refresh. Joins over heavily changed inputs are expensive to refresh incrementally. | Check what is driving the changes in the tables feeding the JOINs. Setting REFRESH_MODE = ADAPTIVE lets Snowflake fall back to a full reinitialization on its own whenever an incremental refresh would cost more. |
EXPENSIVE_ORDER_DEPENDENT_WINDOW_FUNCTION | The query uses an order-dependent window function. Each row’s result depends on neighboring rows, so every refresh has to re-evaluate entire row partitions rather than only the rows that changed. | Consider using REFRESH_MODE = FULL. If applicable, consider replacing the window function with a more incremental-friendly pattern. |
HIGH_BASE_TABLE_CHANGES | A high percentage of rows in the base tables changed since the last refresh. When change rates are high, incremental maintenance costs can be higher than a full refresh. | Check what is driving the large changes in the base tables. Setting REFRESH_MODE = ADAPTIVE lets Snowflake fall back to a full reinitialization on its own whenever an incremental refresh would cost more. |
ICEBERG_BASE_TABLE_V2_TO_V3 | One or more base tables use Iceberg format version 2, which does not track row-level changes. Without change tracking, refreshes read more data than they need to. | Upgrade the affected base tables to Iceberg version 3 so refreshes can read only the rows that changed. |
NON_MONOTONIC_GROUPING_KEY | The dynamic table groups by a non-monotonic function, whose output does not preserve the ordering of its input. Refreshes re-evaluate far more partitions than the volume of changes warrants. | Replace the non-monotonic grouping function with a order-preserving function. |
QUALIFY_RANK_KEYS_NOT_PERSISTED | QUALIFY RANK()/ROW_NUMBER() = 1 is in the outermost SELECT, but its PARTITION BY and ORDER BY keys are not among the dynamic table’s output columns, so refreshes cannot use the fastest incremental path. | Add the PARTITION BY and ORDER BY key expressions to the dynamic table’s SELECT list so they are stored as output columns. |
QUALIFY_RANK_NOT_TOP_LEVEL | The QUALIFY RANK()/ROW_NUMBER() = 1 clause is nested inside the query instead of being in the outermost SELECT, so refreshes cannot use the fastest incremental path. | Restructure the dynamic table so the QUALIFY RANK()/ROW_NUMBER() = 1 clause is in the outermost SELECT. |
TOP_LEVEL_AGGREGATE_EXPRESSIONS_NOT_PERSISTED | The outermost GROUP BY can be refreshed incrementally, but some expressions it depends on are not among the dynamic table’s output columns, so refreshes cannot use the fastest incremental path. | Add the listed expressions to the dynamic table’s SELECT list so refreshes can use the fastest incremental path. |
TOP_LEVEL_AGGREGATE_NOT_TOP_LEVEL | The GROUP BY with incrementally maintainable aggregates (MIN, MAX, COUNT, SUM) is nested inside the query instead of being in the outermost SELECT, so the fast recomputation path is not in use. | Restructure the dynamic table so the GROUP BY and its aggregates are in the outermost SELECT. |
WAREHOUSE_TOO_SMALL | The refresh ran out of memory and spilled data to local or remote storage, which makes it slower and more expensive than it needs to be. | Run this dynamic table’s refreshes on a larger warehouse. See Warehouse selection for dynamic tables. |
Best practices
- Analyzing with CoCo will give you the best experience to analyze, troubleshoot, and apply the insights to the dynamic table in that session.
- Shift optimizations left: If you use a CI/CD workflow, integrate CoCo checks to flag structural issues in dynamic table definitions before they are deployed to production.
- Audit high-throughput tables regularly: High-throughput or mission-critical dynamic tables are most affected by performance bottlenecks. Monitor Dynamic Tables Insights to catch new issues as your pipeline evolves.