- description:
Understanding the assessment results and what comes next
Snowpark Migration Accelerator: Understanding the Assessment Summary
After running an assessment, you can view the initial results and summary in the Assessment Summary Report.
Keep in mind that this report summarizes the assessment output results for the best conversion option for your source code.
The Assessment Results section of the application contains several components, which are explained in detail below.
Analysis Summary
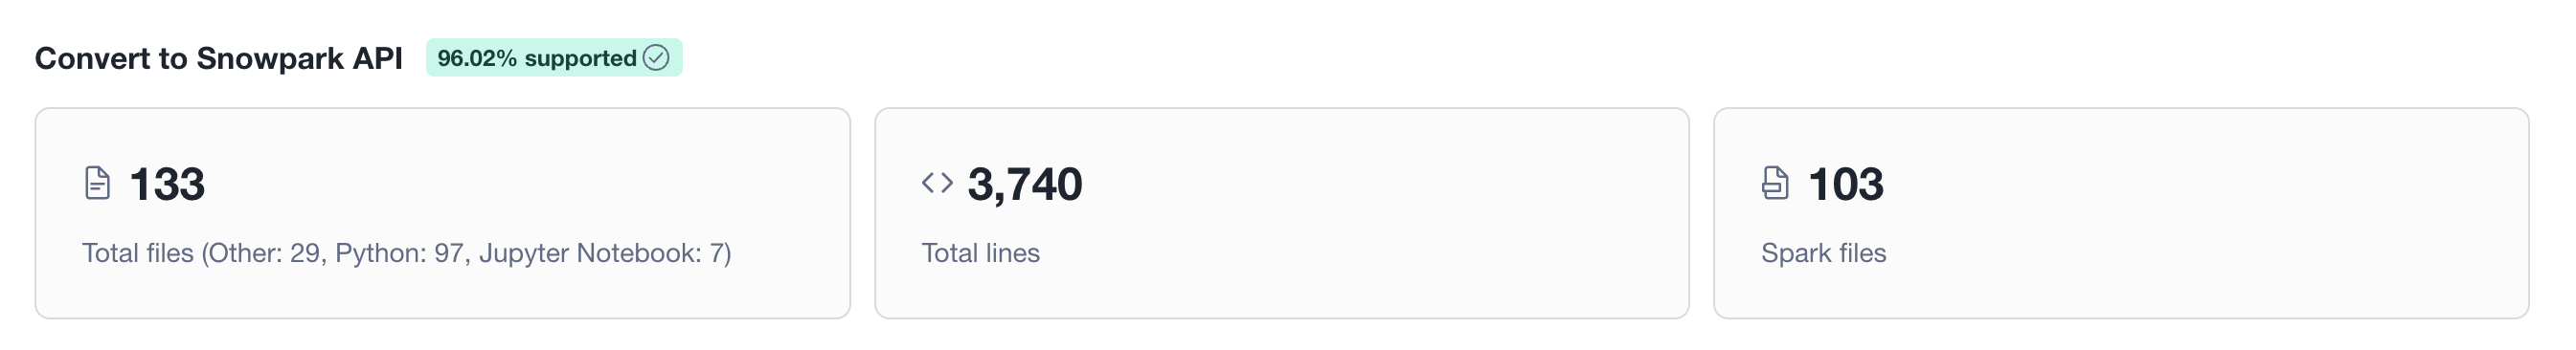
Displays a high-level summary of the codebase analyzed for the best conversion option. The header shows the overall readiness score as a percentage badge. Below, three KPI cards present: the total number of input files broken down by type (Python, Jupyter Notebook, Other), the total line count across all files, and the number of files that contain Spark API references.
File compatibility breakdown
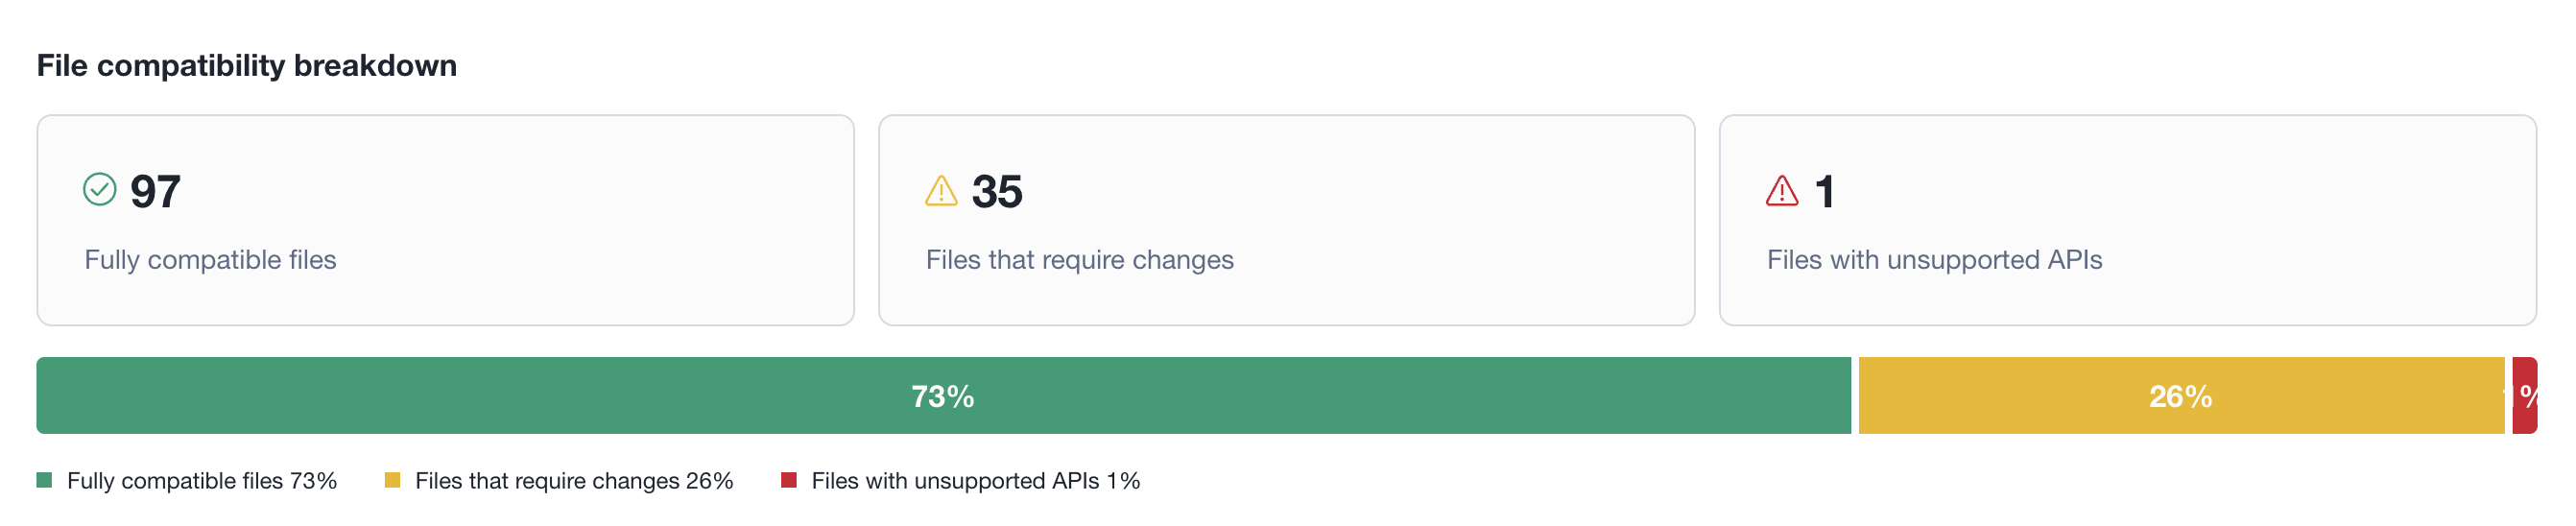
Categorizes all analyzed files into three groups: fully compatible (no changes needed), files that require changes (partial support), and files with unsupported APIs (significant rework needed). Each category shows its count with a severity icon. A stacked bar chart below visualizes the proportional distribution as percentages, with a color-coded legend.
Data distribution
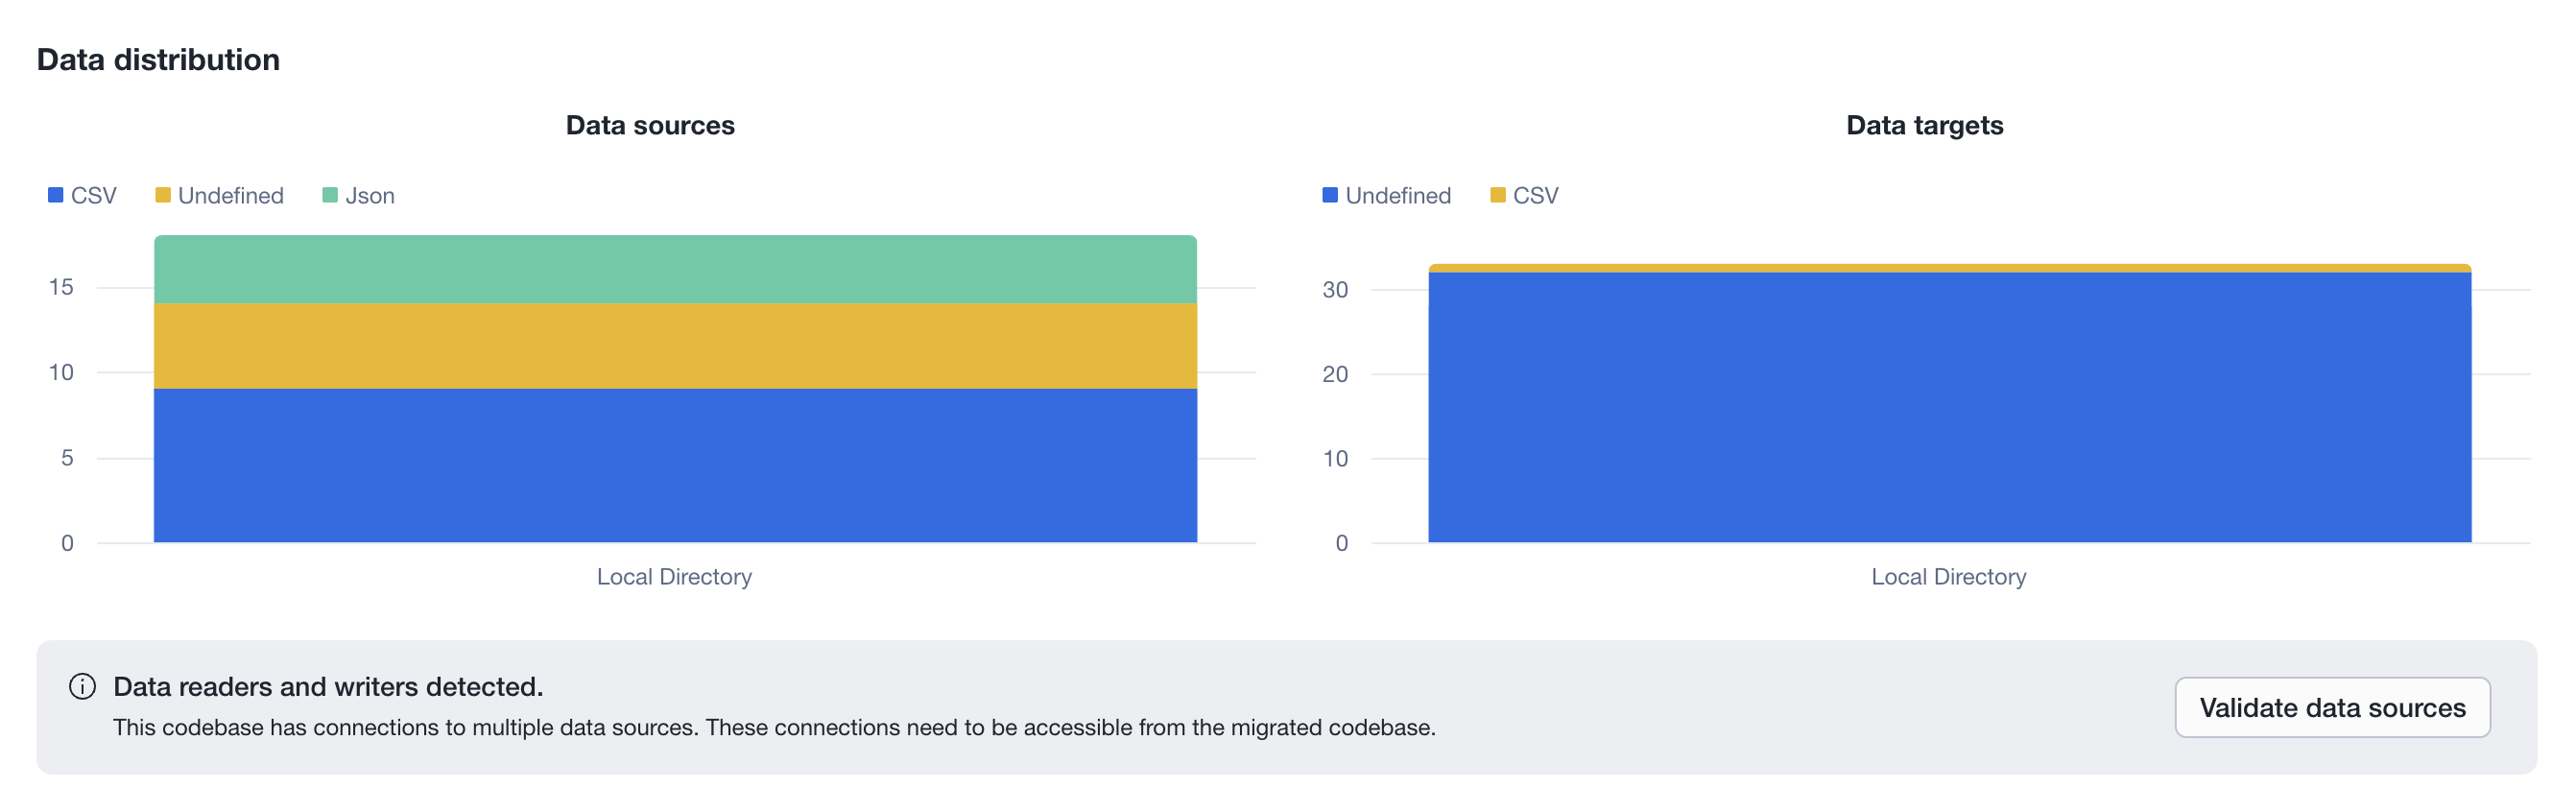
Shows how the codebase reads and writes data, split into two stacked bar charts: Data sources (reads) and Data targets (writes). The X-axis represents the platform or location (e.g., Local Directory, S3, JDBC), and the Y-axis stacks the file formats used (e.g., CSV, Json, Undefined). Each chart has its own independent legend showing only the formats present in its data. An informational banner alerts when external data connections are detected, prompting the user to validate that those sources will be accessible from the migrated codebase.
Code dependencies
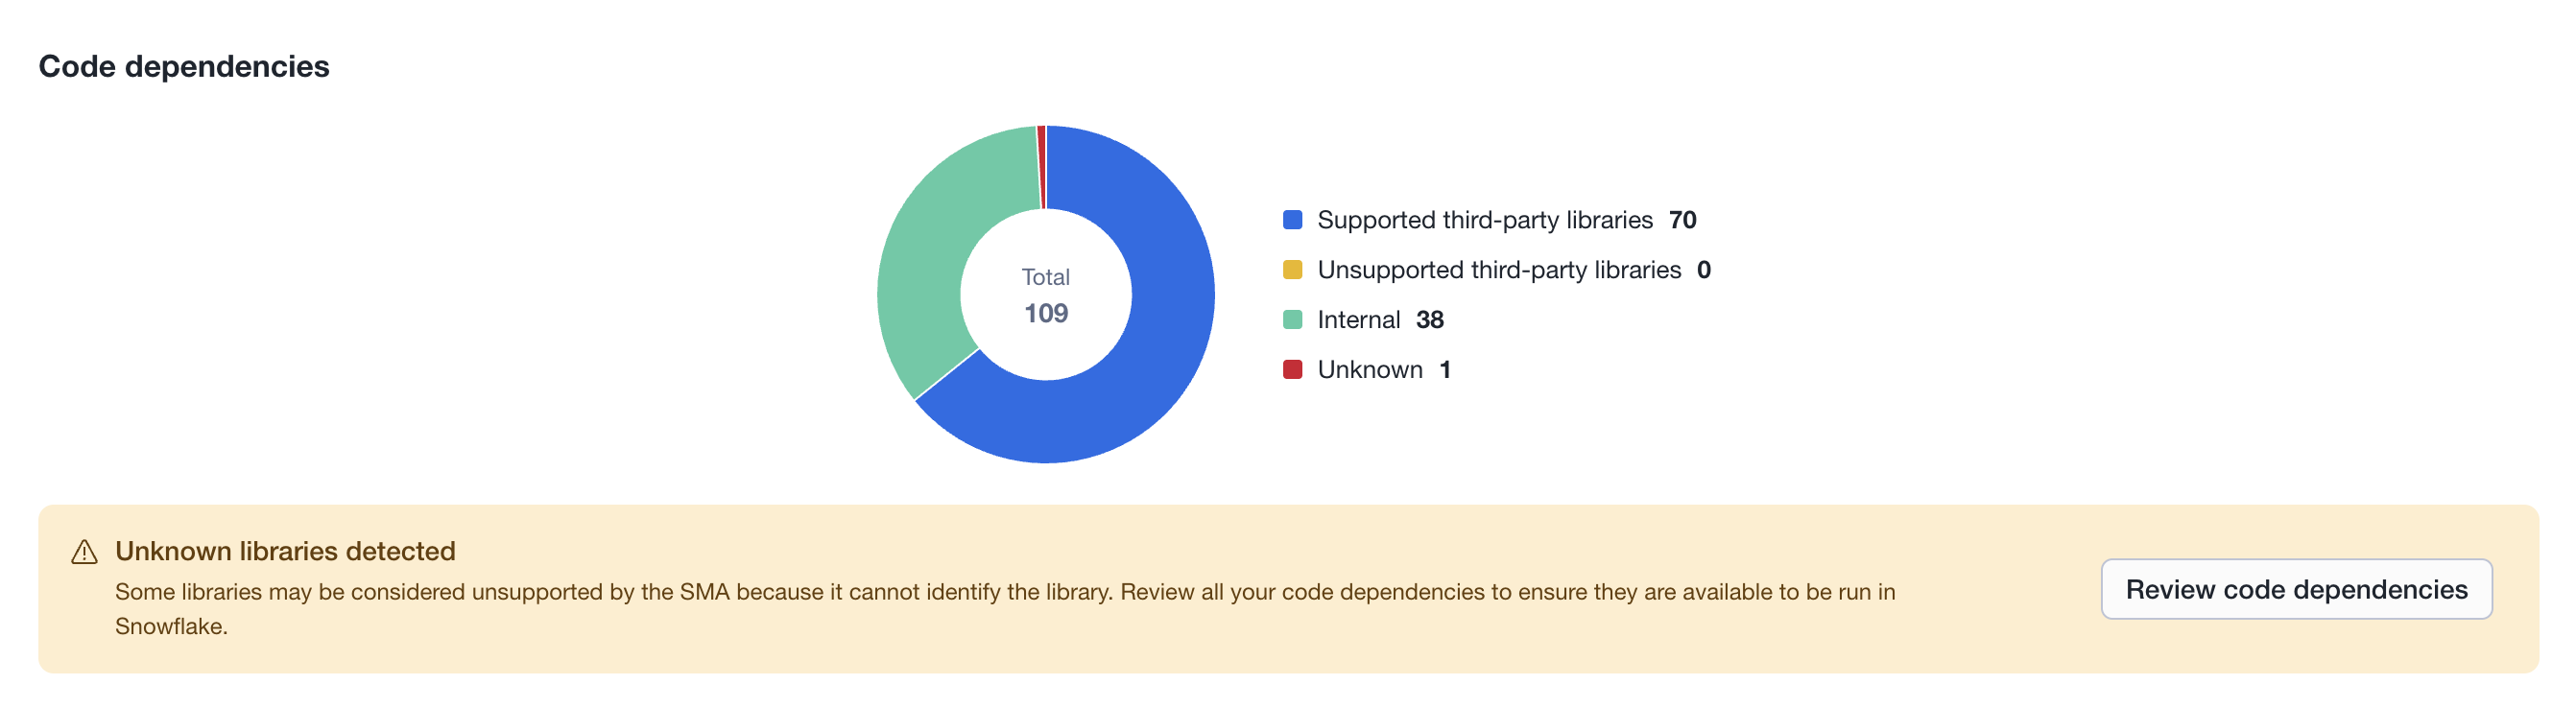
Displays a donut chart summarizing all libraries and packages referenced in the codebase, grouped into four categories: Supported third-party libraries (known to work in Snowflake), Unsupported third-party libraries (third-party but not confirmed as supported), Internal (project-internal modules), and Unknown (libraries the SMA could not identify). The center of the chart shows the total dependency count. A warning banner appears when unknown or unsupported libraries are detected, advising the user to review their code dependencies to ensure they are available in Snowflake.
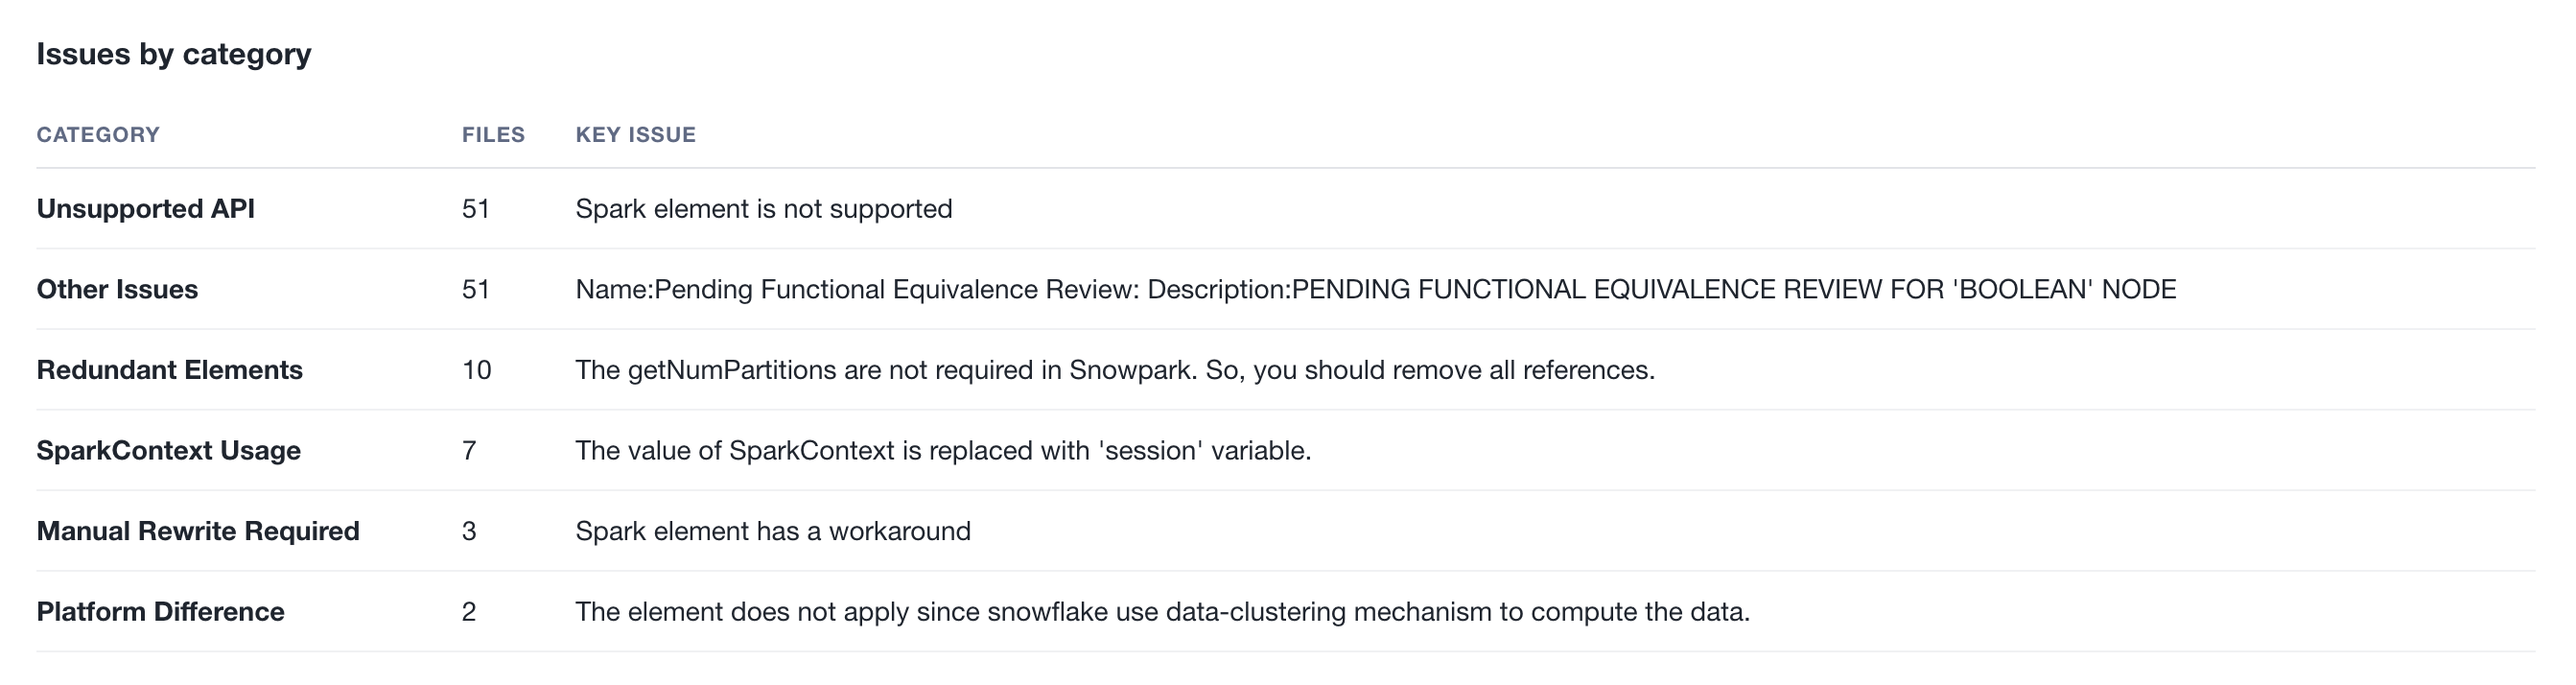
Issues by category
Groups all issues found during the assessment into human-readable categories (e.g., Unsupported API, Redundant Elements, SparkContext Usage). Each row shows the category name, the number of affected files, and a key issue description summarizing the most representative problem in that group. This section requires an active Snowflake connection, as it uses Snowflake Cortex AI to analyze the raw issue codes and generate meaningful category names and descriptions.
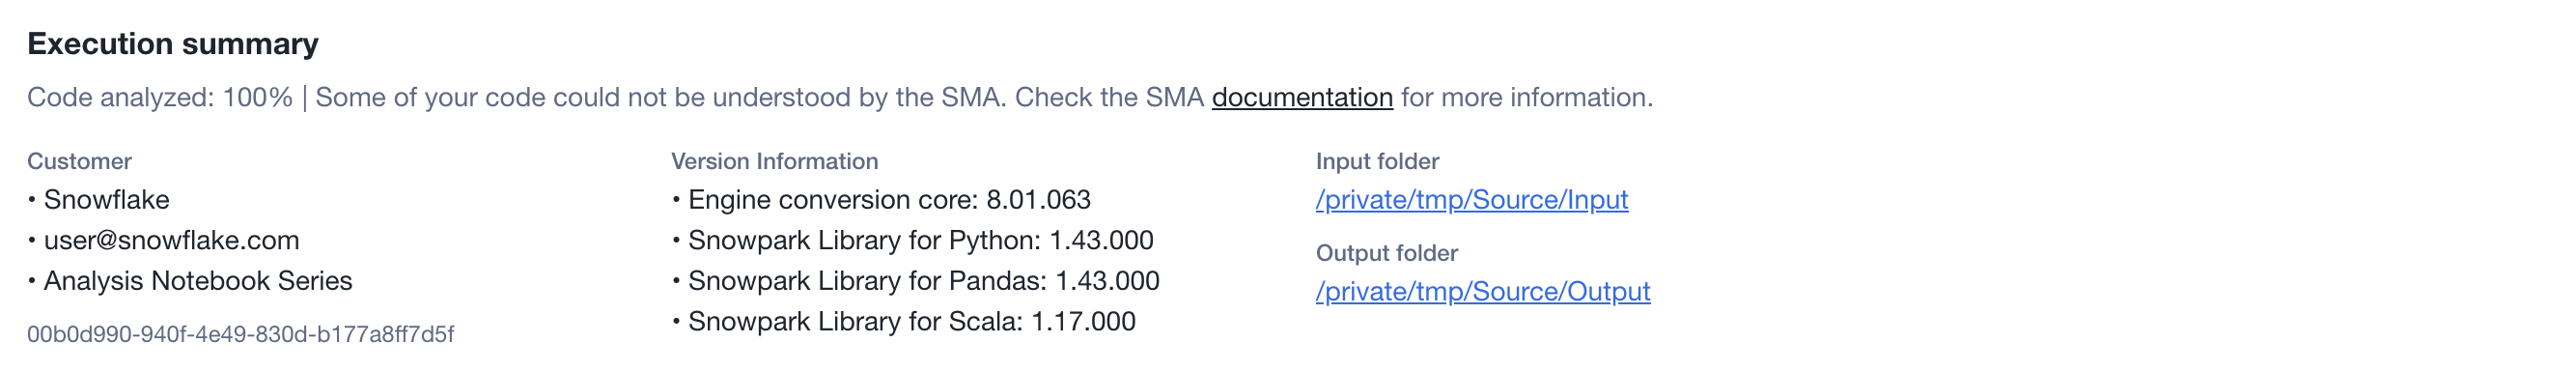
Execution summary
Displays metadata about the assessment run. Includes the analysis coverage percentage and any parsing warnings at the top. Below, it shows the customer information (company, email, project name, and project ID), the engine and library versions used during the assessment, and the input/output folder paths with clickable links to open them directly.
Next Steps
The application provides several additional features, which can be accessed through the interface shown in the image below.

- Primary option - The recommended conversion option for your source code.
- Secondary option - An alternative conversion option for your source code.
- View Reports - Opens the folder containing assessment output reports. These include the detailed assessment report, Spark reference inventory, and other analyses of your source codebase. Each report type is explained in detail in this documentation.